
ABOUT THIS ARTICLE
This article was authored by @Dan_P, @taricha and @Rick Mathew. We collaborated in the development of the experimental methods, the cost of the project and the analysis of the data. The project was started in August of 2021 with the purpose of understanding the quality of the data received from ICP-OES measurements. Our intent is to bring some clarity to the reefing community in order to help evaluate, interpret and respond to this data. What follows are the outcomes of these efforts.
INTRODUCTION & BACKGROUND
If you have been a visitor to the R2R Forums for any length of time, you have most likely run into a post about ICP (Inductively Coupled Plasma). If you do a search on the Forum for “ICP” you will find 20 some pages of posts. Here is a link https://www.reef2reef.com/search/3220407/?q=ICP&o=relevance. When you scanned through these you noticed a number of them had a recurring theme. “I have this report with all of these numbers…Now what?” Are these values real? Can this be right? What should I do?
These Reefers are reacting to the results of their ICP test that is telling them that one or more of their “parameters” are off. They then need to make a decision as to what to do. This very fact is what places a high priority on the quality of the measurement, both the precision and the accuracy. Measurement precision and accuracy statements are hard to come by from the ICP vendors. A statement of measurement uncertainty by element would be very helpful to the Reefing Community. As a matter of fact it has been said that a measurement without knowledge of its uncertainty is of little value (Walter Lewin). Best practices for reporting measurement calls for providing this information .(4) Vendors that do provide such information do so based on samples that are preserved and stored under laboratory conditions. These are not hobby water samples shipped across the globe and stored before testing. These are the samples we used in our experiment to better describe real world performance of ICP-OES measurements. We have seen Limit of detection (LoD) data from a number of vendors; however this does not address the questions of precision and accuracy. This was the motivation for our project. @Dan_P , @taricha and I set out on a quest to take a closer look at these primary questions:
1) Are these measurements real?
2) What is the Repeatability (precision) and does it vary by element?
3) What is the Variability between vendors and does it vary by element
4) What can we say about accuracy?
Very little published information exists that can directly answer these questions or help us evaluate vendors. For example, in 2016 Ross and Maupin (https://reefs.com/magazine/skeptical-reefkeeping-12/ ) sent certified seawater samples in triplicate to Triton to evaluate the ICP service. Our analysis of the data gives a reason to wonder about the quality of data we receive. The analysis (SEE CHART 1) compares the average result for reported element concentrations to the certified standard amounts. A relative accuracy of 100% indicates perfect agreement. A higher or lower amount indicates less than accurate results. The second analysis is the relative standard deviation (RSD) of the results which is the standard deviation divided by the average result. For this statistic, the smaller the number the more precise or replicable were the results. The elements are arranged according to increasing concentrations. Although the RSDs are small, indicating a high repeatability across the elements for samples measured back to back to back, the relative accuracy suggests unreliable measurement below 10ppb Ba. This represents half the elements tested. Because this data only pertains to a single vendor we cannot apply it as a general tool, but only a reference point as to what we might expect from the ICP-OES measurement protocol.

Chart 1A and 1B below show this variation in the 6 highest concentration elements: Ca, Cl, K, Mg, Na, and S. Chart 1A (left) shows that the choice of vendor resulted in a roughly ±5% difference of higher or lower element measurements (relative to the average of all vendor measurements) and this difference was consistent across the 6 elements. Chart 1B (right) shows that the vendors also disagreed about the relative increase or decrease in the element concentrations of this single sample during the storage time with one vendor reporting a consistent 5% increase, and another a >10% decrease - again, largely consistent across the 6 elements.


-------------------------------------------CHART 1A------------------------------------------------------------CHART 1B
If vendor selection and when they analyze the sample introduces variations like those indicated above to the measurement of a single sample, then it’s worthwhile to try to further understand the variations that appear in the measurement process and what we can actually conclude from our ICP test results.
A series of experiments were conducted both individually and collaboratively to seek to answer these questions and evaluate vendors. Although this was not an exhaustive experimental effort and there are admittedly some gaps in the study, we feel that we have gained valuable insight into the quality of data received from ICP vendors which we would like to share. We also would like to share an approach for dealing with ICP data that is not provided with accuracy or precision information.
EXPERIMENTAL SETUP AND METHOD
Sampling:
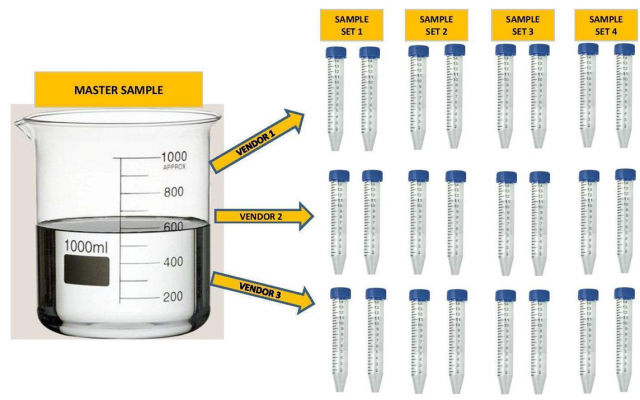
A single large Master sample of either aquarium water or Instant Ocean was taken in each case. Some of the samples were spiked with trace elements, a list of which is below. In the case of the dilution study the samples were diluted with RODI water by a specified percent to represent different levels of salinity (15%, 30% and 40% dilutions). The large samples were then divided into the separate samples required by the vendor. Each vendor got samples from the same exact large sample. In some cases the vendor received multiple samples from the same sample. See Illustration below.

Some experiments had 4 sample sets, some had 3, some had 2 and some had 1. They were sent to multiple vendors up to a maximum of 4 individual vendors. In all but one experiment all of the samples were shipped to the vendors at the same time. In total there were 14 individual Master Samples taken and separated into 34 individual sample sets. Additionally some of the data sets were taken from work that was done by others. (3)
Analysis Procedure:

*Some samples were held back in cold storage and shipped later to evaluate variability over time.
THE FINDINGS
In order to not get bogged down in a massive amount of data, we are going to present the Findings first. The charts and graphs included here are a result of our findings. If you are interested in the gory details we would be glad to provide them to you.
We provide two evaluation procedures that we believe will be useful to judge whether the ICP data you receive is good enough to meet your needs. The first is a vendor evaluation based on our analysis of our entire database of ICP results and does not require knowledge of statistics. The second method is a standard procedure for evaluating analytical methods. It can be used to evaluate vendors based on our database, or if you are comfortable with numbers, can be used to evaluate your data when you collect replicate measurements.
Vendor Evaluation Tool: Is It Real? (Tool # 1)
The first tool is a close look at the reality of a reported measurement. The focus here is on the trace elements not the majors. Being as we did not have Certified Reference Standards, it is difficult to establish accuracy. However, demonstrating failure is easier. If identical samples of water sent to the same vendor generate results of Zero and 1.5ppb for an element, then you can conclude they are not both accurate reflections of your water and thus a reported measurement at the 1ppb level isn't necessarily real. You can cover a lot of ground evaluating vendor performance by identifying failure to measure similar samples similarly. For example, ICP-Analysis (ICP-A) reported Rb at 800ppb and zero from the same water, so that's failure at 1ppb, 10ppb, 100ppb, and maybe 1000ppb
Using this thinking along with information gleaned from our dilution studies, the vendor evaluation chart below was created.


Another data set, when paired with the above charts, helps illustrate the amount and frequency of trace element measurements reported by vendors that are not repeatably distinguished from zero in hobby samples. In the below data, 4 replicates were sent to each vendor. As you can see in charts 3A-D, all vendors reported some non-zero trace elements that were not distinguished from zero across all 4 replicates. It is also apparent that some vendor reports include more of these possible-zero elements and with higher variation than other vendors do.

----------------------------------------------CHART 3A---------------------------------------------------------------------------CHART 3B

------------------------------------------------CHART 3C------------------------------------------------------------------------- CHART 3D
Vendor Evaluation- Gage Variation (Precision) (Tool # 2)
There are two components that are important in any measurement system (gage reading): There is the accuracy, which describes how close the measurement is to the true value, and the precision, which describes how close the measurement is to a previous measurement of the same sample. This is often referred to as the repeatability.
If we assume an instrument produces accurate results but is highly variable (low reproducibility) then the probability that a single measurement is the true value is low. This would mean that the confidence in any single measured value would be low.
The requirement for the level of precision is defined by its purpose of use. For example, measuring the length of a race course that is 10 miles long, a precision of .25 miles could be fine, but if the course is only 1 mile this level of precision would be inadequate.
Bringing this into our reef keeping world, some elements have a precision in parts per million (PPM) while others will be parts per billion (PPB) which is 1000 times smaller. The general practice in the hobby is not to control the level of an element to a specific value, but a range. An example would be calcium 405ppm to 510ppm or a control range of 105ppm. If our measurement gage had a gage variation of 100ppm this would be of little value to us because the precision is almost as large as our control range.
FINDING THE GAGE VARIATION OF A MEASUREMENT SYSTEM
One of the ways to find this variation is to use a method called Gage R&R. It is a scientific study that falls under Measurement System Analysis (MSA). It differs from Relative Standard Deviation (RSD) in that it compares the variability to the element’s required control range. We will not go into any details of this method. In its simplest form it is measuring the same sample multiple times with the same measurement system and doing statistical analysis on the data and producing a value that we will call the Gage Variation. Using this number and knowing individual control range of the elements we can evaluate the relative performance of different measurement systems. In our case the measurement system is different vendors.
EVALUATING THE RESULTS
It is generally accepted practice to use the following scale to evaluate the performance of the measurement system:
High Precision Measurement
The Gage Variation is less than 10% of the control range
Moderate Precision Measurement
The Gage Variation is between 10%-30% of the control range
Low Precision Measurement
The Gage Variation is greater than 30% of the control range.
Using this scale with our example of a calcium control range of 105,
High Precision < 10% of 105 = 10.5 ppm
Moderate Precision < 30% of 105 = 31.5 ppm
Low Precision Measurement > 30% of 105 = > 31.5 ppm
These would represent our Target Precision Values for Calcium using a control range of 105ppm. If the control range were to be expanded or reduced then the target values would increase or decrease accordingly.
To check your understanding of this approach, look at the bars for calcium in CHART 5 below. The bars with the black stripe represent the high and moderate precision level for our 105 ppm control range. The other bars represent the vendor precision in our experiments. You can tell which ones deliver high precision measurements, and which ones deliver moderate precision results. The moderate precision result is not “bad” but it is not useful for a control range of 105. If your control range is larger, this vendor would then be more likely to satisfy your measurement needs.
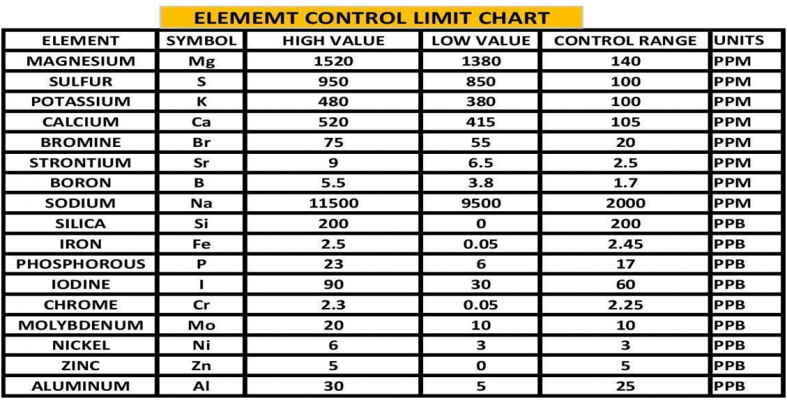
By using the experimental methods we described above we sent multiple sets of the same sample to multiple vendors. We collected the data and generated the Gage Variation for the elements by vendor. Using generally recommended control ranges for the individual elements and the Gage Variation we generated graphic comparisons like the ones below to help us discern the confidence in the values reported for each element by vendor. Chart 4 represents the control limits used in this experiment. These were taken from vendors report sheets. Although there could be much debate about the “exact” figures the basic principle holds true. The performance of a measurement system can be evaluated by its Gage variation relative to the required control range.


THE PROCEDURE
The Vendor Evaluation Procedure”
Below is the procedure we developed to evaluate ICP results before we conclude there is an issue or finding. Tool #1 is our quick evaluation of vendor capability to measure an element’s concentration based on our experimental results. Use this tool to pare down the list of element measurements for further investigation and to eliminate false emergencies. The next tool is the Gage variation. If you don’t have multiple measurements of the same sample, use the results we generated from our pool of ICP data to evaluate whether a vendor has in the past produced measurements with enough precision to satisfy your need.

FIG 1
EXAMPLES
EXAMPLE 1---Major Element Data (PPM) (Na, Mg, S, Ca, K)
The Situation
The ICP report indicates that one or more of these elements are out of range by 30% or more. Your home test indicates it is not.
The Data
Vendor Evaluation Is it Real?
Because these are major elements Tool # 1 does not apply.
Vendor Evaluation Gage precision:
Locate your element and vendor. Note the precision value in relationship to your desired precision (high or moderate).
The Assessment
Focus your attention on the precision value of the vendor for that element. This will tell you if the measurement value is reliable, i.e. would the vendor be able to reproduce this value if they re-measured the sample? If the precision value is equal to or less than the target value selected (high or moderate), then you can have a degree of confidence that the measurement is of sufficient precision for the elements control range. However if the precision value is greater than the target value then the precision would not be sufficient for measurement for the elements control range at the level of precision required (high or moderate). Using CHART 5 and 7 above for:
Calcium (Ca) 3 of the 4 vendors were able to deliver high precision whereas one was able to deliver only moderate precision.
Potassium (K) all of the vendors can deliver better than moderate precision and close to high precision values.
For Magnesium (Mg) none of the vendors delivered high precision
IT IS IMPORTANT TO REMEMBER WE ARE ONLY LOOKING AT PRECISION NOT ACCURACY! It is possible that these measurements are very precise but precisely wrong...Low accuracy high precision (See Fig 2). We have very little data as it relates to the accuracy of different vendors. We can gain some insight on the accuracy from the Ross-Maupin article mentioned above, as it relates to a single vendor using the ICP-OES. However this does not answer the question of individual vendor’s accuracy. That being said if the Gage variability is high meaning low precision, even if the vendor is accurate the chances of any single measurement being the true value is low. This is especially true if the target (represented by the control range) is small.

FIG 2Possible Courses of Action:
For Calcium (Ca) ---Based on the above assessment I would tend to believe the measurement value from 3 of the 4 vendors. I would assume that my measurement was incorrect and work to validate and improve my test procedure (1) before making any adjustments. The measurement from the vendor represents the state of your system several days ago and things will be different so I would not make the adjustment based on the vendor measurement, but dial it in using my validated test method.
For Potassium (K) --- Based on the above assessment I would tend to believe the measurement value from the vendors. I would assume that my measurement was incorrect and work to validate and improve my test procedure (1) before making any adjustments. The measurement from the vendor represents the state of your system several days ago and things will be different so I would not make the adjustment based on the vendor measurement, but dial it in using my validated test method.
For Magnesium (Mg) --- Based on the above assessment I would be skeptical of any of the values reported by the vendors based on a control range of 140 ppm. The gage variability for all of the vendors for this element are all in the moderate range and approaching the top of the range with exception of one vendor. I would assume my test measurement to be equally valid and would make any adjustments according to my testing results. In addition I would validate and improve my test method.
EXAMPLE 2---PHOSPHOROUS (PPB)
The Situation
Your home measurement is 35ppb but the vendor measurement is 13 ppb.
The Data
Vendor Evaluation Is it Real?
With the exception of one vendor the reported value will most likely be a real value if the level is 10ppm or above. If it falls in this range, the next question is how reliable is the measurement value.
Vendor Evaluation Gage precision:
Chart 9 indicates that none of the vendors were able to provide a high precision measurement for phosphorous. This would mean that the reported value even if the vendor can accurately measure phosphorous, has a low probability of being the true value and depending on the vendor could have± 8-88 ppb variability. This would not be adequate for making any system changes based on the above control limits of 6-23 ppb because the variability is too high.
Possible Courses of Action:
Based on the above assessment I would be skeptical of the reported value. Again it is important to remember that the measurement results are on a water sample taken several days earlier. Your system will not be the same so I would make no adjustments based on the reported value. I would instead work to validate my own test procedure (1) and determine its variability and base my actions on this data.
Special Note on Phosphorous
Phosphorous belongs to a group of elements that can be depleted over time because of their bioactivity. This group also included Silica, Iron, and Iodine. This group of “possible-zero” elements is of interest to hobbyists who often wish to manage them towards some non-zero target. It’s also the most challenging group for measurement by ICP for the same reason: these elements are often near zero, and biological processes can have a large appetite for their consumption. This process continues when a sample is stored and or shipped. This would mean the initial sample measurement could be different then the measurement of the same sample several days later.
We have done some extensive experiments that demonstrate this principle. You can read about it here (2)
So these are just two examples of how one might use the results of this set of experiments to help you to interpret your ICP test results. The procedure described in Fig 1 can be used with any of the elements. There was not sufficient data to provide a complete set of Gage Variation Charts but most of the elements we would be concerned with are included and the Vendor Evaluation Charts (2 & 3) as well as Chart 1 can help guide the interpretation.
This is for sure not a comprehensive study. There were only 4 vendors and limited number of samples, but none the less it provides a general picture of ICP-OES capabilities and a way of qualitatively looking at the results of an ICP report to help decide a course of action.
This study produced a great deal more data information that is not included in this document. This includes the raw data used in the study, an explanation of each of the approaches to the analysis. We have attached some of the documents in case you desire to look into the further. If you would like additional information just PM the authors (@Dan_P, @taricha and @Rick Mathew)
If we take a step back from the details of this work and have a look at some general conclusion what might they be?
1) ICP-OES as currently practiced can provide sufficient levels of precision for some elements to help effectively manage a reef system.
2) There are some elements that ICP-OES as currently practiced cannot provide sufficient levels of precision in order to be confident in a single measurement to allow effective management of a reef system.
3) The variability of the measurement of Magnesium is unexpectedly high for all of the vendors evaluated.
4) The single vendor accuracy assessment conducted by Ross and Maupin indicate the ICP-OES as practiced by this single vendor produce results that for some elements are sufficient for use in managing a reef system and some elements are not.
5) Precision performance varies by element, in a manner largely dependent on element concentration regardless of vendor. Each group: major, trace, or in- between has elements that are better- or worse-measured than other elements in the same group.
6) A significant portion of the measured values of trace elements appear to not be “real” - that is, the reported values are not well distinguished from zero by a vendor doing multiple analyses on the same samples. This significant portion can be the majority of measured trace elements for some ICP vendor reports.
7) There is variability between vendors and it varies by element. No two vendors will generate the same results from the same samples. Comparison of vendor results to an expected standard will show that even the vendors that do the “best” will have misses on some elements that are “worse” than other vendors.
REFERENCES AND LINKS
(1) These 4 articles can help validate and improve your home testing methods
https://www.reef2reef.com/ams/getting-it-right-make-testing-count-by-using-a-quality-system-approach.741/
https://www.reef2reef.com/ams/part-2-getting-it-right-make-testing-count-by-using-a-quality-system-approach-colorimetric-visual-testing.744/
https://www.reef2reef.com/ams/part-3-getting-it-right-colorimetric-visual-testing-methods-what-we-see.747/
https://www.reef2reef.com/ams/part-4-getting-it-right-colorimetric-instrumental-testing-methods-digital.748/
(2) Storage effect on ICP test results link
https://www.reef2reef.com/ams/sample-storage-and-its-impact-on-measurement-results-part-3.800/
(3) Additional Data Sets used from work by others.
Ross & Maupin https://reefs.com/magazine/skeptical-reefkeeping-12/
Ross---Data provided for single vendor multiple samples different shipment dates
Fritz Aquatics https://fritzaquatics.com/assets/files/uploads/ICP_TES.pdf
(4) Best Practices in Reporting Measurements
https://www.sigmamagic.com/blogs/measurement-uncertainty/
https://www.isobudgets.com/how-to-report-uncertainty-in-measurement/
https://www.youtube.com/watch?v=6htJHmPq0Os
This article was authored by @Dan_P, @taricha and @Rick Mathew. We collaborated in the development of the experimental methods, the cost of the project and the analysis of the data. The project was started in August of 2021 with the purpose of understanding the quality of the data received from ICP-OES measurements. Our intent is to bring some clarity to the reefing community in order to help evaluate, interpret and respond to this data. What follows are the outcomes of these efforts.
INTRODUCTION & BACKGROUND
If you have been a visitor to the R2R Forums for any length of time, you have most likely run into a post about ICP (Inductively Coupled Plasma). If you do a search on the Forum for “ICP” you will find 20 some pages of posts. Here is a link https://www.reef2reef.com/search/3220407/?q=ICP&o=relevance. When you scanned through these you noticed a number of them had a recurring theme. “I have this report with all of these numbers…Now what?” Are these values real? Can this be right? What should I do?
These Reefers are reacting to the results of their ICP test that is telling them that one or more of their “parameters” are off. They then need to make a decision as to what to do. This very fact is what places a high priority on the quality of the measurement, both the precision and the accuracy. Measurement precision and accuracy statements are hard to come by from the ICP vendors. A statement of measurement uncertainty by element would be very helpful to the Reefing Community. As a matter of fact it has been said that a measurement without knowledge of its uncertainty is of little value (Walter Lewin). Best practices for reporting measurement calls for providing this information .(4) Vendors that do provide such information do so based on samples that are preserved and stored under laboratory conditions. These are not hobby water samples shipped across the globe and stored before testing. These are the samples we used in our experiment to better describe real world performance of ICP-OES measurements. We have seen Limit of detection (LoD) data from a number of vendors; however this does not address the questions of precision and accuracy. This was the motivation for our project. @Dan_P , @taricha and I set out on a quest to take a closer look at these primary questions:
1) Are these measurements real?
2) What is the Repeatability (precision) and does it vary by element?
3) What is the Variability between vendors and does it vary by element
4) What can we say about accuracy?
Very little published information exists that can directly answer these questions or help us evaluate vendors. For example, in 2016 Ross and Maupin (https://reefs.com/magazine/skeptical-reefkeeping-12/ ) sent certified seawater samples in triplicate to Triton to evaluate the ICP service. Our analysis of the data gives a reason to wonder about the quality of data we receive. The analysis (SEE CHART 1) compares the average result for reported element concentrations to the certified standard amounts. A relative accuracy of 100% indicates perfect agreement. A higher or lower amount indicates less than accurate results. The second analysis is the relative standard deviation (RSD) of the results which is the standard deviation divided by the average result. For this statistic, the smaller the number the more precise or replicable were the results. The elements are arranged according to increasing concentrations. Although the RSDs are small, indicating a high repeatability across the elements for samples measured back to back to back, the relative accuracy suggests unreliable measurement below 10ppb Ba. This represents half the elements tested. Because this data only pertains to a single vendor we cannot apply it as a general tool, but only a reference point as to what we might expect from the ICP-OES measurement protocol.
CHART 1
While the Ross and Maupin data raises questions about the reliability of data for low concentration elements, Fritz Aquatics released a multi-vendor, multi-time study (https://fritzaquatics.com/assets/files/uploads/ICP_TES.pdf) that indicates variability in even the highest concentration elements. Fritz prepared a single master sample of their salt mix and sent it to multiple vendors twice, about a month apart.Chart 1A and 1B below show this variation in the 6 highest concentration elements: Ca, Cl, K, Mg, Na, and S. Chart 1A (left) shows that the choice of vendor resulted in a roughly ±5% difference of higher or lower element measurements (relative to the average of all vendor measurements) and this difference was consistent across the 6 elements. Chart 1B (right) shows that the vendors also disagreed about the relative increase or decrease in the element concentrations of this single sample during the storage time with one vendor reporting a consistent 5% increase, and another a >10% decrease - again, largely consistent across the 6 elements.
-------------------------------------------CHART 1A------------------------------------------------------------CHART 1B
If vendor selection and when they analyze the sample introduces variations like those indicated above to the measurement of a single sample, then it’s worthwhile to try to further understand the variations that appear in the measurement process and what we can actually conclude from our ICP test results.
A series of experiments were conducted both individually and collaboratively to seek to answer these questions and evaluate vendors. Although this was not an exhaustive experimental effort and there are admittedly some gaps in the study, we feel that we have gained valuable insight into the quality of data received from ICP vendors which we would like to share. We also would like to share an approach for dealing with ICP data that is not provided with accuracy or precision information.
EXPERIMENTAL SETUP AND METHOD
Sampling:
A single large Master sample of either aquarium water or Instant Ocean was taken in each case. Some of the samples were spiked with trace elements, a list of which is below. In the case of the dilution study the samples were diluted with RODI water by a specified percent to represent different levels of salinity (15%, 30% and 40% dilutions). The large samples were then divided into the separate samples required by the vendor. Each vendor got samples from the same exact large sample. In some cases the vendor received multiple samples from the same sample. See Illustration below.
Some experiments had 4 sample sets, some had 3, some had 2 and some had 1. They were sent to multiple vendors up to a maximum of 4 individual vendors. In all but one experiment all of the samples were shipped to the vendors at the same time. In total there were 14 individual Master Samples taken and separated into 34 individual sample sets. Additionally some of the data sets were taken from work that was done by others. (3)
Analysis Procedure:
*Some samples were held back in cold storage and shipped later to evaluate variability over time.
THE FINDINGS
In order to not get bogged down in a massive amount of data, we are going to present the Findings first. The charts and graphs included here are a result of our findings. If you are interested in the gory details we would be glad to provide them to you.
We provide two evaluation procedures that we believe will be useful to judge whether the ICP data you receive is good enough to meet your needs. The first is a vendor evaluation based on our analysis of our entire database of ICP results and does not require knowledge of statistics. The second method is a standard procedure for evaluating analytical methods. It can be used to evaluate vendors based on our database, or if you are comfortable with numbers, can be used to evaluate your data when you collect replicate measurements.
Vendor Evaluation Tool: Is It Real? (Tool # 1)
The first tool is a close look at the reality of a reported measurement. The focus here is on the trace elements not the majors. Being as we did not have Certified Reference Standards, it is difficult to establish accuracy. However, demonstrating failure is easier. If identical samples of water sent to the same vendor generate results of Zero and 1.5ppb for an element, then you can conclude they are not both accurate reflections of your water and thus a reported measurement at the 1ppb level isn't necessarily real. You can cover a lot of ground evaluating vendor performance by identifying failure to measure similar samples similarly. For example, ICP-Analysis (ICP-A) reported Rb at 800ppb and zero from the same water, so that's failure at 1ppb, 10ppb, 100ppb, and maybe 1000ppb
Using this thinking along with information gleaned from our dilution studies, the vendor evaluation chart below was created.
CHART 2
CHART 3
CHART 2 & 3 KEY
ICP-A = ICP Analysis FM= Fauna Marin
To use the chart, select the vendor, find the element and the ppb range it is being reported in and note the color code. Read the description based on the color code. Where the color is black, there was insufficient information to evaluate the vendor and element. If the color is red then there is most likely no need to go any further because the measurement is a value that is not consistently distinguished from zero. By going through the trace elements in your ICP report using this chart you can decide whether the measurement of an unwanted (or desired) trace element is actually large enough to be confident of its level in your water. ICP-A = ICP Analysis FM= Fauna Marin
Another data set, when paired with the above charts, helps illustrate the amount and frequency of trace element measurements reported by vendors that are not repeatably distinguished from zero in hobby samples. In the below data, 4 replicates were sent to each vendor. As you can see in charts 3A-D, all vendors reported some non-zero trace elements that were not distinguished from zero across all 4 replicates. It is also apparent that some vendor reports include more of these possible-zero elements and with higher variation than other vendors do.
----------------------------------------------CHART 3A---------------------------------------------------------------------------CHART 3B
------------------------------------------------CHART 3C------------------------------------------------------------------------- CHART 3D
Vendor Evaluation- Gage Variation (Precision) (Tool # 2)
There are two components that are important in any measurement system (gage reading): There is the accuracy, which describes how close the measurement is to the true value, and the precision, which describes how close the measurement is to a previous measurement of the same sample. This is often referred to as the repeatability.
If we assume an instrument produces accurate results but is highly variable (low reproducibility) then the probability that a single measurement is the true value is low. This would mean that the confidence in any single measured value would be low.
The requirement for the level of precision is defined by its purpose of use. For example, measuring the length of a race course that is 10 miles long, a precision of .25 miles could be fine, but if the course is only 1 mile this level of precision would be inadequate.
Bringing this into our reef keeping world, some elements have a precision in parts per million (PPM) while others will be parts per billion (PPB) which is 1000 times smaller. The general practice in the hobby is not to control the level of an element to a specific value, but a range. An example would be calcium 405ppm to 510ppm or a control range of 105ppm. If our measurement gage had a gage variation of 100ppm this would be of little value to us because the precision is almost as large as our control range.
FINDING THE GAGE VARIATION OF A MEASUREMENT SYSTEM
One of the ways to find this variation is to use a method called Gage R&R. It is a scientific study that falls under Measurement System Analysis (MSA). It differs from Relative Standard Deviation (RSD) in that it compares the variability to the element’s required control range. We will not go into any details of this method. In its simplest form it is measuring the same sample multiple times with the same measurement system and doing statistical analysis on the data and producing a value that we will call the Gage Variation. Using this number and knowing individual control range of the elements we can evaluate the relative performance of different measurement systems. In our case the measurement system is different vendors.
EVALUATING THE RESULTS
It is generally accepted practice to use the following scale to evaluate the performance of the measurement system:
High Precision Measurement
The Gage Variation is less than 10% of the control range
Moderate Precision Measurement
The Gage Variation is between 10%-30% of the control range
Low Precision Measurement
The Gage Variation is greater than 30% of the control range.
Using this scale with our example of a calcium control range of 105,
High Precision < 10% of 105 = 10.5 ppm
Moderate Precision < 30% of 105 = 31.5 ppm
Low Precision Measurement > 30% of 105 = > 31.5 ppm
These would represent our Target Precision Values for Calcium using a control range of 105ppm. If the control range were to be expanded or reduced then the target values would increase or decrease accordingly.
To check your understanding of this approach, look at the bars for calcium in CHART 5 below. The bars with the black stripe represent the high and moderate precision level for our 105 ppm control range. The other bars represent the vendor precision in our experiments. You can tell which ones deliver high precision measurements, and which ones deliver moderate precision results. The moderate precision result is not “bad” but it is not useful for a control range of 105. If your control range is larger, this vendor would then be more likely to satisfy your measurement needs.
By using the experimental methods we described above we sent multiple sets of the same sample to multiple vendors. We collected the data and generated the Gage Variation for the elements by vendor. Using generally recommended control ranges for the individual elements and the Gage Variation we generated graphic comparisons like the ones below to help us discern the confidence in the values reported for each element by vendor. Chart 4 represents the control limits used in this experiment. These were taken from vendors report sheets. Although there could be much debate about the “exact” figures the basic principle holds true. The performance of a measurement system can be evaluated by its Gage variation relative to the required control range.
CHART 4
CHART 5
CHART 6
CHART 7
CHART 8
CHART 9
CHART 10
CHART 11
THE PROCEDURE
The Vendor Evaluation Procedure”
Below is the procedure we developed to evaluate ICP results before we conclude there is an issue or finding. Tool #1 is our quick evaluation of vendor capability to measure an element’s concentration based on our experimental results. Use this tool to pare down the list of element measurements for further investigation and to eliminate false emergencies. The next tool is the Gage variation. If you don’t have multiple measurements of the same sample, use the results we generated from our pool of ICP data to evaluate whether a vendor has in the past produced measurements with enough precision to satisfy your need.
FIG 1
EXAMPLES
EXAMPLE 1---Major Element Data (PPM) (Na, Mg, S, Ca, K)
The Situation
The ICP report indicates that one or more of these elements are out of range by 30% or more. Your home test indicates it is not.
The Data
Vendor Evaluation Is it Real?
Because these are major elements Tool # 1 does not apply.
Vendor Evaluation Gage precision:
Locate your element and vendor. Note the precision value in relationship to your desired precision (high or moderate).
The Assessment
Focus your attention on the precision value of the vendor for that element. This will tell you if the measurement value is reliable, i.e. would the vendor be able to reproduce this value if they re-measured the sample? If the precision value is equal to or less than the target value selected (high or moderate), then you can have a degree of confidence that the measurement is of sufficient precision for the elements control range. However if the precision value is greater than the target value then the precision would not be sufficient for measurement for the elements control range at the level of precision required (high or moderate). Using CHART 5 and 7 above for:
Calcium (Ca) 3 of the 4 vendors were able to deliver high precision whereas one was able to deliver only moderate precision.
Potassium (K) all of the vendors can deliver better than moderate precision and close to high precision values.
For Magnesium (Mg) none of the vendors delivered high precision
IT IS IMPORTANT TO REMEMBER WE ARE ONLY LOOKING AT PRECISION NOT ACCURACY! It is possible that these measurements are very precise but precisely wrong...Low accuracy high precision (See Fig 2). We have very little data as it relates to the accuracy of different vendors. We can gain some insight on the accuracy from the Ross-Maupin article mentioned above, as it relates to a single vendor using the ICP-OES. However this does not answer the question of individual vendor’s accuracy. That being said if the Gage variability is high meaning low precision, even if the vendor is accurate the chances of any single measurement being the true value is low. This is especially true if the target (represented by the control range) is small.
FIG 2
For Calcium (Ca) ---Based on the above assessment I would tend to believe the measurement value from 3 of the 4 vendors. I would assume that my measurement was incorrect and work to validate and improve my test procedure (1) before making any adjustments. The measurement from the vendor represents the state of your system several days ago and things will be different so I would not make the adjustment based on the vendor measurement, but dial it in using my validated test method.
For Potassium (K) --- Based on the above assessment I would tend to believe the measurement value from the vendors. I would assume that my measurement was incorrect and work to validate and improve my test procedure (1) before making any adjustments. The measurement from the vendor represents the state of your system several days ago and things will be different so I would not make the adjustment based on the vendor measurement, but dial it in using my validated test method.
For Magnesium (Mg) --- Based on the above assessment I would be skeptical of any of the values reported by the vendors based on a control range of 140 ppm. The gage variability for all of the vendors for this element are all in the moderate range and approaching the top of the range with exception of one vendor. I would assume my test measurement to be equally valid and would make any adjustments according to my testing results. In addition I would validate and improve my test method.
EXAMPLE 2---PHOSPHOROUS (PPB)
The Situation
Your home measurement is 35ppb but the vendor measurement is 13 ppb.
The Data
Vendor Evaluation Is it Real?
With the exception of one vendor the reported value will most likely be a real value if the level is 10ppm or above. If it falls in this range, the next question is how reliable is the measurement value.
Vendor Evaluation Gage precision:
Chart 9 indicates that none of the vendors were able to provide a high precision measurement for phosphorous. This would mean that the reported value even if the vendor can accurately measure phosphorous, has a low probability of being the true value and depending on the vendor could have± 8-88 ppb variability. This would not be adequate for making any system changes based on the above control limits of 6-23 ppb because the variability is too high.
Possible Courses of Action:
Based on the above assessment I would be skeptical of the reported value. Again it is important to remember that the measurement results are on a water sample taken several days earlier. Your system will not be the same so I would make no adjustments based on the reported value. I would instead work to validate my own test procedure (1) and determine its variability and base my actions on this data.
Special Note on Phosphorous
Phosphorous belongs to a group of elements that can be depleted over time because of their bioactivity. This group also included Silica, Iron, and Iodine. This group of “possible-zero” elements is of interest to hobbyists who often wish to manage them towards some non-zero target. It’s also the most challenging group for measurement by ICP for the same reason: these elements are often near zero, and biological processes can have a large appetite for their consumption. This process continues when a sample is stored and or shipped. This would mean the initial sample measurement could be different then the measurement of the same sample several days later.
We have done some extensive experiments that demonstrate this principle. You can read about it here (2)
So these are just two examples of how one might use the results of this set of experiments to help you to interpret your ICP test results. The procedure described in Fig 1 can be used with any of the elements. There was not sufficient data to provide a complete set of Gage Variation Charts but most of the elements we would be concerned with are included and the Vendor Evaluation Charts (2 & 3) as well as Chart 1 can help guide the interpretation.
This is for sure not a comprehensive study. There were only 4 vendors and limited number of samples, but none the less it provides a general picture of ICP-OES capabilities and a way of qualitatively looking at the results of an ICP report to help decide a course of action.
This study produced a great deal more data information that is not included in this document. This includes the raw data used in the study, an explanation of each of the approaches to the analysis. We have attached some of the documents in case you desire to look into the further. If you would like additional information just PM the authors (@Dan_P, @taricha and @Rick Mathew)
SUMMING IT UP
If we take a step back from the details of this work and have a look at some general conclusion what might they be?
1) ICP-OES as currently practiced can provide sufficient levels of precision for some elements to help effectively manage a reef system.
2) There are some elements that ICP-OES as currently practiced cannot provide sufficient levels of precision in order to be confident in a single measurement to allow effective management of a reef system.
3) The variability of the measurement of Magnesium is unexpectedly high for all of the vendors evaluated.
4) The single vendor accuracy assessment conducted by Ross and Maupin indicate the ICP-OES as practiced by this single vendor produce results that for some elements are sufficient for use in managing a reef system and some elements are not.
5) Precision performance varies by element, in a manner largely dependent on element concentration regardless of vendor. Each group: major, trace, or in- between has elements that are better- or worse-measured than other elements in the same group.
6) A significant portion of the measured values of trace elements appear to not be “real” - that is, the reported values are not well distinguished from zero by a vendor doing multiple analyses on the same samples. This significant portion can be the majority of measured trace elements for some ICP vendor reports.
7) There is variability between vendors and it varies by element. No two vendors will generate the same results from the same samples. Comparison of vendor results to an expected standard will show that even the vendors that do the “best” will have misses on some elements that are “worse” than other vendors.
REFERENCES AND LINKS
(1) These 4 articles can help validate and improve your home testing methods
https://www.reef2reef.com/ams/getting-it-right-make-testing-count-by-using-a-quality-system-approach.741/
https://www.reef2reef.com/ams/part-2-getting-it-right-make-testing-count-by-using-a-quality-system-approach-colorimetric-visual-testing.744/
https://www.reef2reef.com/ams/part-3-getting-it-right-colorimetric-visual-testing-methods-what-we-see.747/
https://www.reef2reef.com/ams/part-4-getting-it-right-colorimetric-instrumental-testing-methods-digital.748/
(2) Storage effect on ICP test results link
https://www.reef2reef.com/ams/sample-storage-and-its-impact-on-measurement-results-part-3.800/
(3) Additional Data Sets used from work by others.
Ross & Maupin https://reefs.com/magazine/skeptical-reefkeeping-12/
Ross---Data provided for single vendor multiple samples different shipment dates
Fritz Aquatics https://fritzaquatics.com/assets/files/uploads/ICP_TES.pdf
(4) Best Practices in Reporting Measurements
https://www.sigmamagic.com/blogs/measurement-uncertainty/
https://www.isobudgets.com/how-to-report-uncertainty-in-measurement/
https://www.youtube.com/watch?v=6htJHmPq0Os