
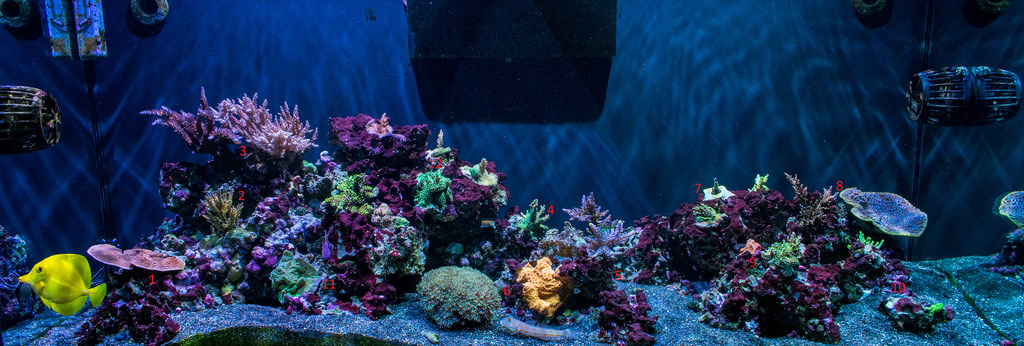
I have 2 hydra 52 HD’s over a 50 gallon 24x24x20 cube. Let me know if y’all would like some approximate par readings with my apogee mq 510 par meter.
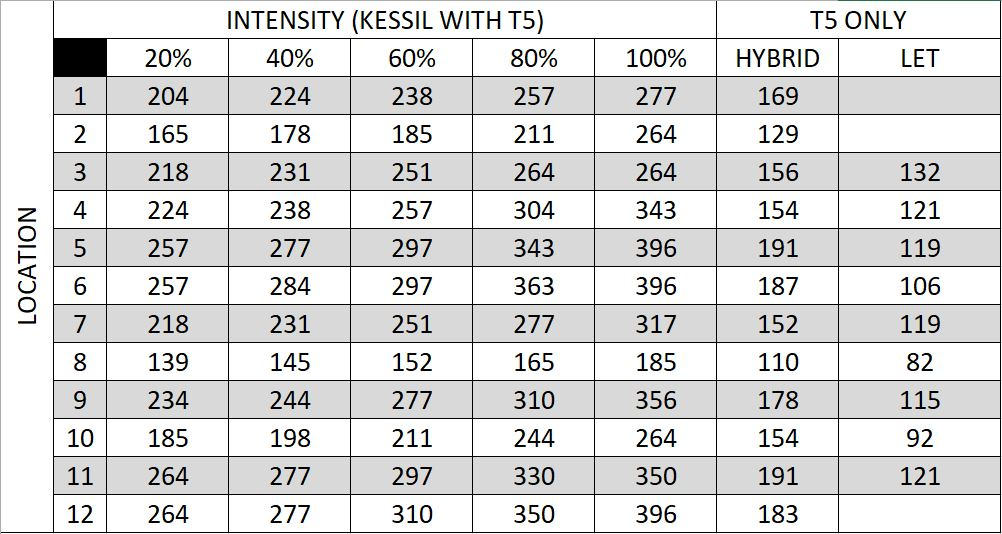
Apogee mq 510 par readings
- Thread starter Charlie’s Frags
- Start date
- Tagged users None
Users Who Are Viewing This Thread (Total: 1, Members: 0, Guests: 1)
Similar threads
- Price: $450.00
- Shipping Available
- Price: $150
- Shipping Available

New Posts
-
 Michigan WTB Wtb external skimmer shipped to michigan
- Latest: vetteguy53081
-
-


