
Effect of UV-A Spectrum on Acropora Growth and Coloration
Hypothesis:
Preparation :
I do not have space in my house to do this. Therefore I will be collaborating with a LFS here in Singapore to carry out this investigation. Let me know if you have any suggestions to improve this process.
Thank you for your time!
Hypothesis:
- UV-A supplementation can increase the growth in acropora sp.
- UV-A supplementation can initate or increase the production of fluoroproteins in acropora sp.
Preparation :
- Two fresh frags from a single acropora are made and fixed on frag tiles with scale.
- The frags are labeled E (experimental) and C (control).
- The frags are placed in the same aquarium, approx 6" apart. A black acrylic sheet is placed in-between them.
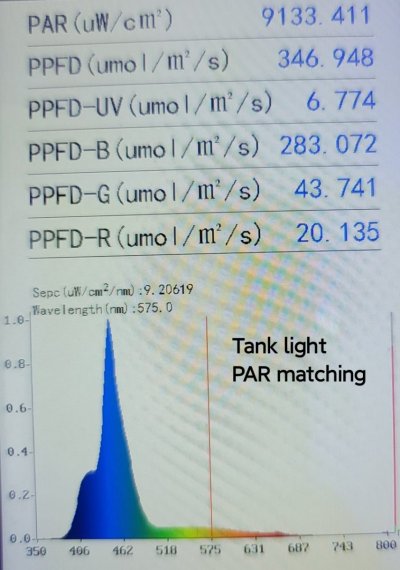
- Using a spectrum photometer, measure the PAR and spectrum profile at both frags.
- Adjust the position of the frags to achieve matching PAR and spectrum.
- Culture the frag for one week to allow healing and observe encrustation.
- Test and record water parameter.
- Install a UV light strip (360nm, 380nm) over the experiment group.
- Ramp up the intensity of the UV over 1 week, to approx 15% of the original PAR.
- Diameter of encrusted base, weekly;
- Height of frag, weekly;
- Observable growth tips, weekly;
- The coloration will be measured by taking photos of both frags using manual camera mode, with identical exporsure parameters, and edited using identical process (saved preset in Adobe Photoshop Express), weekly;
I do not have space in my house to do this. Therefore I will be collaborating with a LFS here in Singapore to carry out this investigation. Let me know if you have any suggestions to improve this process.
Thank you for your time!


")