Dashboard and Data gave me a successful tank

fdevans

Community Member
View Badges
Joined
Sep 10, 2021
Messages
72
Reaction score
53
Location
Paso Robles
Rating - 0%
0   0   0
Thought I'd share something that has significantly improved my aquarium success. It's a bit technical but after seeing a few posts here on R2R about using Telegraf-InfluxDB-Grafana and creating a dashboard I've been able to stabilize my tank to the point that things are growing quite well and issues are noticed early by the rest of the non-reefing family.


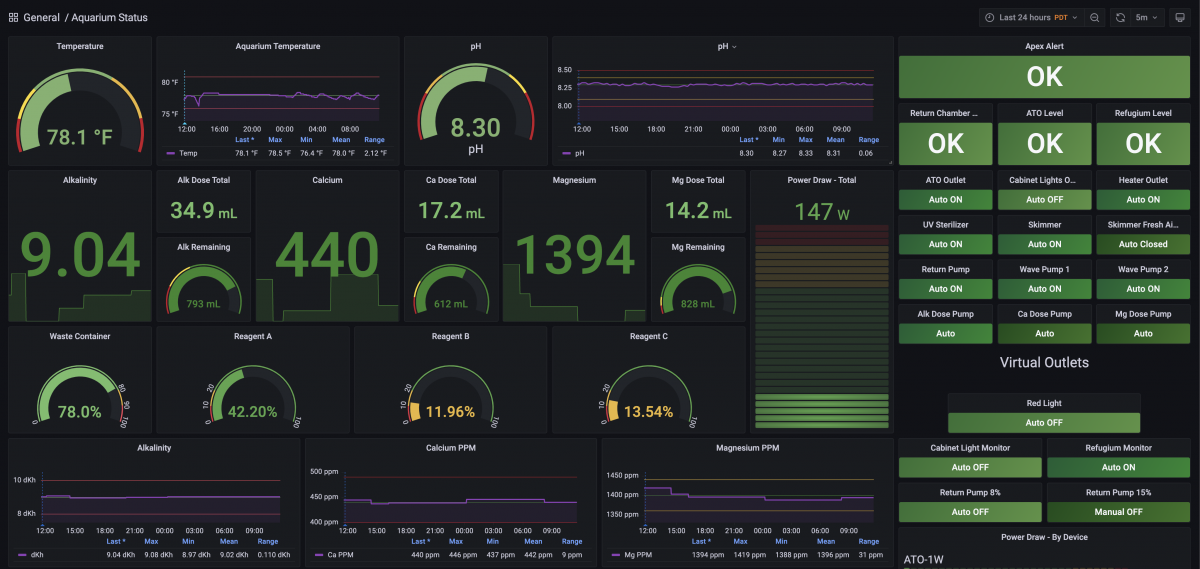
This view is left on a monitor in my office, which also happens to be right near a high traffic area of the house. The greens are used to identify healthy and when something is off or out of reasonable ranges they will turn red. Now the family will come and say... "Hey, the tank is red" and I can check things out quickly.
Screen Shot 2022-04-25 at 11.35.35 AM.png


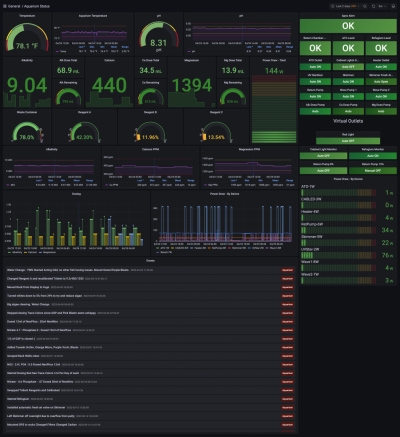
The full page of details is attached so it doesn't take up all the post. There are more details bits of info about power usage and I'm using Grafana's annotations feature to track important events. I preferred this method over using what's built into the Apex because the annotation line (blue dashed line) shows up on all the timeline graphs. As an example, the line show above is a water change, which helps me remember why temperature had a drop and Magnesium had a drop.

All of the numbers are from my Apex unit which makes use of the Trident for testing and 2 DOS pumps for feeding CA, ALK, MG. Some of the numbers were easily available from the Telegraf Neptune Apex Plugin, but some of the others I had to add my own input plugin to grab. It's all running on a Raspberry Pi 3B+ at the moment. (new bigger badder Pi coming soon)

Overall, this has helped me get dosing to a very consistent level. I'm able to make fine tuned adjustments to how much of each element is dosed and know exactly when I might need to go buy more Trident supplies or empty the waste container. I was even able to diagnose a phantom "Alert is Off" message that never had an "Alert is On" which turned out to be a wattage spike on a device. (It never happened again so not sure why, but I at least knew why the alert triggered)

I'll do my best to answer questions about this, but setting it up isn't trivial. I did take some notes on the first build, and maybe when I move everything to the new RPi I'll document how to set it up start to finish. Unfortunately Neptune doesn't make sharing the dashboards easy since everyone's device addresses will be unique to their setup, but the data is there and I could probably write up enough guidance to get folks started. The more likes this gets the more likely I'll post those setup docs. See update notes below.

Credits:
I know I read the original setup somewhere here, but didn't save the link. If anyone knows the author of the Telegraf input plugin let me know so I can credit their work.
This article helped as well
screencapture-192-168-111-172-3000-d-aiCCWUWnk-aquarium-status-2022-04-25-11_28_29.png

Latest Edits/Updates:
4/25/2022 - I've added a GitHub repository with steps and helpful code examples here. More details in thread below.
 
Last edited:

swallace

Active Member
View Badges
Joined
Feb 23, 2022
Messages
143
Reaction score
208
Location
Atlanta
Rating - 0%
0   0   0
I use the Grafana stack pretty extensively at work - how are you getting the data without something like SNMP?

Edit: looks like someone has found a way to get it from Apex. NVM
 
OP
OP
fdevans

fdevans

Community Member
View Badges
Joined
Sep 10, 2021
Messages
72
Reaction score
53
Location
Paso Robles
Rating - 0%
0   0   0
Grafana is just pulling from influxDB. The data collection is done through Telegraf using a mix of the Apex plugin and an http plugin to get some additional numbers. Telegraf stuffs it into Influx which Grafana plays well with.
 

rcmike

Valuable Member
View Badges
Joined
Feb 3, 2010
Messages
1,137
Reaction score
519
Location
TN
Rating - 0%
0   0   0
Is there any tutorial on how to do this? Looks very cool.
 
OP
OP
fdevans

fdevans

Community Member
View Badges
Joined
Sep 10, 2021
Messages
72
Reaction score
53
Location
Paso Robles
Rating - 0%
0   0   0
@rcmike
I'm going to see if I can simplify it with some scripts and instructions for setting up on a Raspberry Pi when I have time. It's a bit complicated and takes a bit of work once the data collection is working to build the dashboards based on your setup. As I have time I'll setup somewhere to get that started and maybe the community can help with content.
 

rcmike

Valuable Member
View Badges
Joined
Feb 3, 2010
Messages
1,137
Reaction score
519
Location
TN
Rating - 0%
0   0   0
@rcmike
I'm going to see if I can simplify it with some scripts and instructions for setting up on a Raspberry Pi when I have time. It's a bit complicated and takes a bit of work once the data collection is working to build the dashboards based on your setup. As I have time I'll setup somewhere to get that started and maybe the community can help with content.
Awesome! I have a couple of Rasberry Pi laying around that I had running octoprint on my 3D printers. I may give it a shot.
 
OP
OP
fdevans

fdevans

Community Member
View Badges
Joined
Sep 10, 2021
Messages
72
Reaction score
53
Location
Paso Robles
Rating - 0%
0   0   0

ruim228

New Member
View Badges
Joined
Sep 7, 2019
Messages
9
Reaction score
1
Rating - 0%
0   0   0
@fdevans how were you able to get the following measurements?
apex_dosing, apex_inputs and trident_levels
I can get neptune_apex from the plugin but none of the other ones. Does it have to be Json V2 format?
 

ruim228

New Member
View Badges
Joined
Sep 7, 2019
Messages
9
Reaction score
1
Rating - 0%
0   0   0
Are you having trouble gathering the numbers or displaying them on a dashboard?
I am not able to get them on telegraf. I am looking to get the trident reagents and the and my dosing container levels.
TIA
 
OP
OP
fdevans

fdevans

Community Member
View Badges
Joined
Sep 10, 2021
Messages
72
Reaction score
53
Location
Paso Robles
Rating - 0%
0   0   0
Are you using both Input Plugins from here?:


I don't remember (without some digging) what values I had to get from the /rest/status JSON endpoint and what values came with the neptuen.apex input plugin that comes with Telegraf.

My Grafana tiles for the Trident Levels are configured like this if it helps.
Screen Shot 2022-08-26 at 11.36.07 AM.png


The Dosing Containers was a bit more complicated for me. (I've been meaning to add that breakdown to the repository). The are a sum of the dosing amounts, over a period of time, that is then subtracted from a Dashboard Variable for the size of the dosing container. The time period is determined by another variable called "alkChange" (for Alk Container) that is an Epoch date of when I last "filled it up" to the value stored for the size of the container.

Screen Shot 2022-08-26 at 11.38.09 AM.png


Screen Shot 2022-08-26 at 11.45.52 AM.png


I have read that the official Neptune DOS Containers can provide that number, but I don't have them so I don't know how those would get pulled in. I just use the Red Sea bottles directly.
 

ruim228

New Member
View Badges
Joined
Sep 7, 2019
Messages
9
Reaction score
1
Rating - 0%
0   0   0
Are you using both Input Plugins from here?:


I don't remember (without some digging) what values I had to get from the /rest/status JSON endpoint and what values came with the neptuen.apex input plugin that comes with Telegraf.

My Grafana tiles for the Trident Levels are configured like this if it helps.
Screen Shot 2022-08-26 at 11.36.07 AM.png


The Dosing Containers was a bit more complicated for me. (I've been meaning to add that breakdown to the repository). The are a sum of the dosing amounts, over a period of time, that is then subtracted from a Dashboard Variable for the size of the dosing container. The time period is determined by another variable called "alkChange" (for Alk Container) that is an Epoch date of when I last "filled it up" to the value stored for the size of the container.

Screen Shot 2022-08-26 at 11.38.09 AM.png


Screen Shot 2022-08-26 at 11.45.52 AM.png


I have read that the official Neptune DOS Containers can provide that number, but I don't have them so I don't know how those would get pulled in. I just use the Red Sea bottles directly.
That helps. I did see those numbers but couldn't figure out why so high...Thanks!
1661540855627.png
 
OP
OP
fdevans

fdevans

Community Member
View Badges
Joined
Sep 10, 2021
Messages
72
Reaction score
53
Location
Paso Robles
Rating - 0%
0   0   0
Yeah, I can't remember how I figured out the divide by 250 part, but I think it was just trial and error comparing the number to what was in Fusion.
 

ruim228

New Member
View Badges
Joined
Sep 7, 2019
Messages
9
Reaction score
1
Rating - 0%
0   0   0
Are you having trouble gathering the numbers or displaying them on a dashboard?
I still can't get "apex_dosing and trident_levels" to show on my influx apex measurements


InfluxDB shell version: 1.8.10
> use apex
Using database apex
> show measurements
name: measurements
name
----
6_1
6_2
cpu
disk
diskio
http
kernel
mem
neptune_apex
processes
swap
system
>
 
OP
OP
fdevans

fdevans

Community Member
View Badges
Joined
Sep 10, 2021
Messages
72
Reaction score
53
Location
Paso Robles
Rating - 0%
0   0   0
@ruim228 I'm so sorry... my `telegraf.conf ` on the repository wasn't up to date.

I just pushed an updated version that includes more http inputs for those measurements. Don't forget to update the IP addresses on each entry.

New version is pushed here:
 

ruim228

New Member
View Badges
Joined
Sep 7, 2019
Messages
9
Reaction score
1
Rating - 0%
0   0   0
@fdevans For those who have the apex dosing containers will need this extra lines in their config file...

[[inputs.http.json_v2]]
measurement_name = "container_levels"
[[inputs.http.json_v2.field]]
path = "outputs.21.status.4"
rename = "alk_reagent_left"
[[inputs.http.json_v2.field]]
path = "outputs.22.status.4"
rename = "cal_reagent_left"

:)
 
OP
OP
fdevans

fdevans

Community Member
View Badges
Joined
Sep 10, 2021
Messages
72
Reaction score
53
Location
Paso Robles
Rating - 0%
0   0   0
Which URL are you pulling those from? rest/status or somewhere else? Would you mind sending me the JSON output for each one?

I'm also curious if the Trident Levels code needed any changes beyond the IP address? I wasn't sure if the levels numbers would align to the same reagent bottles in every setup.
 

ruim228

New Member
View Badges
Joined
Sep 7, 2019
Messages
9
Reaction score
1
Rating - 0%
0   0   0
Which URL are you pulling those from? rest/status or somewhere else? Would you mind sending me the JSON output for each one?

I'm also curious if the Trident Levels code needed any changes beyond the IP address? I wasn't sure if the levels numbers would align to the same reagent bottles in every setup.
the container volume is from /rest/status...and everything aligns with the IP address but the percent of reagent liquid and test left needs some figuring...
,{"status":["TBL","","OK","2000","1791"],"name":"ALK","gid":"doser_6","type":"dos","ID":22,"did":"6_1"}
,{"status":["TBL","","OK","2000","719"],"name":"CALCIUM","gid":"doser_6","type":"dos","ID":23,"did":"6_2"}

my telegraf config file...which still needs some adjusting...

[[inputs.neptune_apex]]
servers = [
"http://192.168.1.51"
]


[[inputs.http]]
## One or more URLs from which to read formatted metrics
urls = [
"http://192.168.1.51/rest/status"
]
## Optional HTTP headers
username = "admin"
password = "xxxxxxxx"
data_format = "json_v2"
[[inputs.http.json_v2]]
measurement_name = "trident_levels"
[[inputs.http.json_v2.field]]
path = "modules.#.extra.levels.1"
rename = "other_level"
[[inputs.http.json_v2.field]]
path = "modules.#.extra.levels.2"
rename = "reagent_c"
[[inputs.http.json_v2.field]]
path = "modules.#.extra.levels.3"
rename = "reagent_b"
[[inputs.http.json_v2.field]]
path = "modules.#.extra.levels.4"
rename = "reagent_a"
[[inputs.http.json_v2.field]]
path = "modules.#.extra.levels.0"
rename = "waste"
#########
[[inputs.http]]
## One or more URLs from which to read formatted metrics
urls = [
"http://192.168.1.51/rest/status"
]
## Optional HTTP headers
username = "admin"
password = "xxxxxxxx"
data_format = "json_v2"
[[inputs.http.json_v2]]
measurement_name = "container_levels"
[[inputs.http.json_v2.field]]
path = "outputs.21.status.4"
rename = "alk_reagent_left"
[[inputs.http.json_v2.field]]
path = "outputs.22.status.4"
rename = "cal_reagent_left"


########
[[inputs.http]]
urls = [
"http://192.168.1.51/rest/status"
]
## Optional HTTP headers
username = "admin"
password = "xxxxxxxx"
data_format = "json_v2"
[[inputs.http.json_v2]]
measurement_name = "apex_inputs"
[[inputs.http.json_v2.object]]
path = "inputs"
tags = ["did","name","type"]


[[inputs.http]]
urls = [
"http://192.168.1.51/rest/dlog"
]
## Optional HTTP headers
username = "admin"
password = "xxxxxx"
data_format = "json_v2"
[[inputs.http.json_v2]]
measurement_name = "apex_dosing"
[[inputs.http.json_v2.object]]
path = "dlog.record"
timestamp_key = "date"
timestamp_format = "unix"
timestamp_timezone = "America/New_York"
tags = ["did"]

1661967098061.png
1661967173830.png

1661967233704.png
1661967408833.png
 
OP
OP
fdevans

fdevans

Community Member
View Badges
Joined
Sep 10, 2021
Messages
72
Reaction score
53
Location
Paso Robles
Rating - 0%
0   0   0
OK. So I'm wondering if there may have been a way to get this with the neptune_apex module. The outputs aren't constructed any different than all the others. Did you try running this to see what it was gathering?
show series on apex;

These commands might find yours specifically:

show series on apex from "neptune_apex" WHERE "device_id" =~ /6_1/
show series on apex from "neptune_apex" WHERE "device_id" =~ /6_2/


My concern about that telegraf.conf section is that it's specific to the output ID in the payload. Anyone wanting to set up theirs next would need to adjust that as well. Managing against the device_id and querying for that in Grafana is a bit easier to adjust along the way since the data gathering would still be happening from the start.
 

Caring for your picky eaters: What do you feed your finicky fish?

  • Live foods

    Votes: 22 31.4%
  • Frozen meaty foods

    Votes: 56 80.0%
  • Soft pellets

    Votes: 11 15.7%
  • Masstick (or comparable)

    Votes: 7 10.0%
  • Other

    Votes: 4 5.7%
Back
Top