


Graphs

pickupman66

5000 Club Member
View Badges
Joined
Aug 10, 2010
Messages
6,032
Reaction score
1,165
Location
Winchester, TN
Rating - 0%
0   0   0
so I thought this was interesting. Here is a graph of the last 48 hours in my tank. you can see the exact correlation between the PH, ORP and the Lights coming on and off. Keep in mind, I am running a modified lighting cycle that starts as a 4 hours halides, then 6 of the actinics then 4 more halides. then 10 hours of darkness.
Ph ranges from 7.77 to 7.97
Orp from 356 to 367 (not dosing and need to re-calibrate it)
Amps peak at 8.6 with the halides.
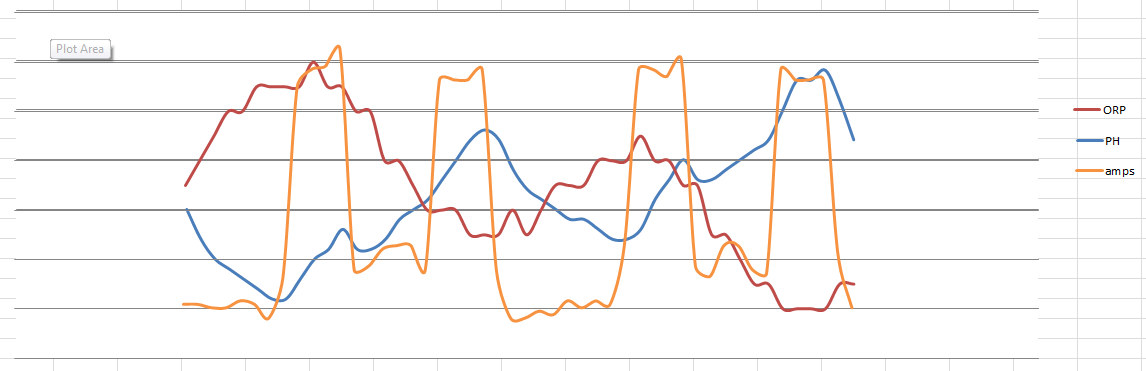
StatsGraph.png
 
Yes. Pulled from my rke. I downloadedthe csv and made graphs in excel. Then played them on top of each other

Sent from my SAMSUNG-SGH-I897 using Tapatalk
 

WHAT’S THE HARDEST PART OF REEFING TO EXPLAIN TO A NON-REEFER?

  • Why a tiny coral frag can cost that much

    Votes: 5 23.8%
  • Why I spend time testing and adjusting water

    Votes: 5 23.8%
  • Why the fish I want might not fit my tank

    Votes: 4 19.0%
  • Why I have buckets, tubing, and salt around the house

    Votes: 1 4.8%
  • Why corals are living animals, not decorations

    Votes: 7 33.3%
  • How much time and attention a reef takes

    Votes: 7 33.3%
  • The difference between freshwater and saltwater creatures

    Votes: 1 4.8%
  • I’ve stopped trying to explain

    Votes: 8 38.1%
  • Other (Post in the comments)

    Votes: 0 0.0%
Back
Top
Home
Post thread…
Market
What's new