

Neptune Exporter | Prometheus | Grafana

image321.jpg

New Member
View Badges
Joined
Dec 30, 2021
Messages
7
Reaction score
5
Location
San Diego
Rating - 0%
0   0   0
Hello All,

After seeing recent conversations on this topic, but not finding anyone sharing their code or how to do it, Ive decided to release my own Neptune Exporter for Prometheus to the community. Go easy on me as it originally wasn't intended to be shared and was more for personal use. However now that Im releasing it to the masses I plan to support and grow it officially.

There are essentially 2 exporters in this release, but function as one. 1, is the exporter for the Neptune Apex on your network. 2, is for Neptune Fusion.
The reason to use Fusion data is because it has the Measurement Log data from the app. So if you log for example a Copper measurement in the Fusion App. That data will only live in Fusion. That is until you scrape the data into Prometheus.

The repo includes scripts that will guide the less Linux skilled community members through setting up necessary configuration files, and installation of all 3 softwares which Ive only tested it on Rocky 9 so far, but it should work on others like CentOS 7. It should include everything be the actual dashboard, but if there is enough demand I can make a how-to on creating dashboards with the data.

The GitHub repo for this is at https://github.com/dl-romero/neptune_exporter. Please refer there for documentations / how-to's.
I know this forum is preferred, but please Report Bugs and Submit Feature Requests at https://github.com/dl-romero/neptune_exporter/issues as it helps with tracking and prioritizing.
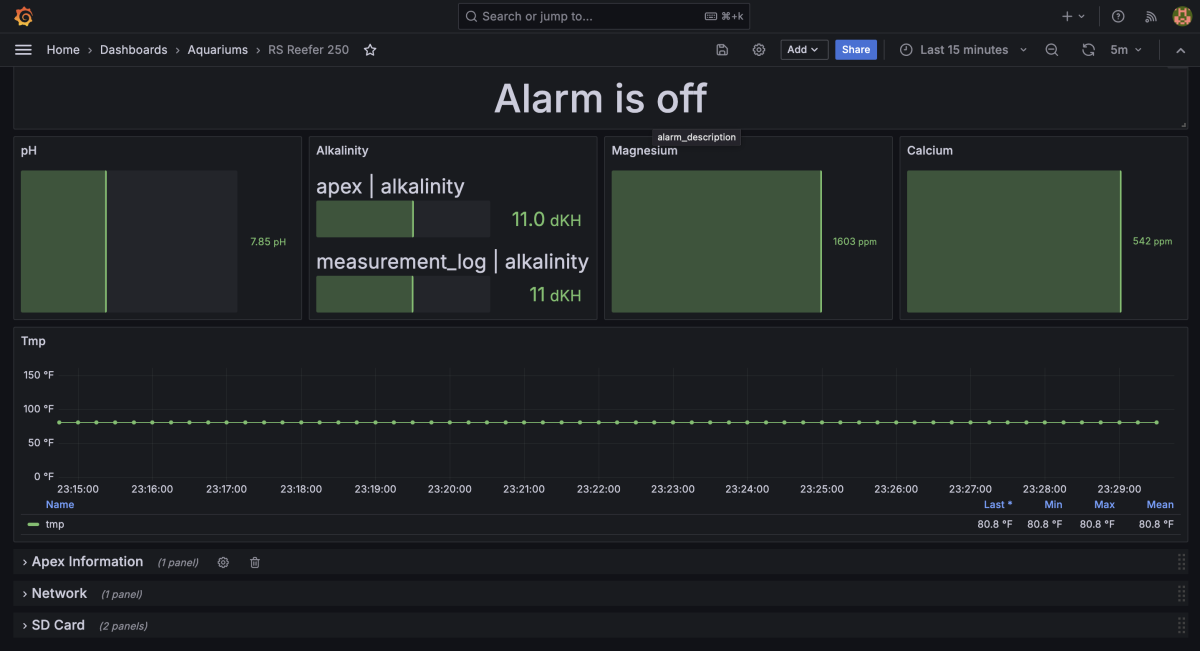
grafana.png


Cheers!
 

Attachments

  • grafana.png
    grafana.png
    95.6 KB · Views: 411
Hello All,

After seeing recent conversations on this topic, but not finding anyone sharing their code or how to do it, Ive decided to release my own Neptune Exporter for Prometheus to the community. Go easy on me as it originally wasn't intended to be shared and was more for personal use. However now that Im releasing it to the masses I plan to support and grow it officially.

There are essentially 2 exporters in this release, but function as one. 1, is the exporter for the Neptune Apex on your network. 2, is for Neptune Fusion.
The reason to use Fusion data is because it has the Measurement Log data from the app. So if you log for example a Copper measurement in the Fusion App. That data will only live in Fusion. That is until you scrape the data into Prometheus.

The repo includes scripts that will guide the less Linux skilled community members through setting up necessary configuration files, and installation of all 3 softwares which Ive only tested it on Rocky 9 so far, but it should work on others like CentOS 7. It should include everything be the actual dashboard, but if there is enough demand I can make a how-to on creating dashboards with the data.

The GitHub repo for this is at https://github.com/dl-romero/neptune_exporter. Please refer there for documentations / how-to's.
I know this forum is preferred, but please Report Bugs and Submit Feature Requests at https://github.com/dl-romero/neptune_exporter/issues as it helps with tracking and prioritizing.

grafana.png


Cheers!

Nice!

I more or less use HomeAssistant for this charting now (and there is a HACS add-on for this as well), but HA does struggle with way too much historical data. Can't be bothered to also run Grafana, but this fits nicely into a lot of stacks.
 
Hello All,

After seeing recent conversations on this topic, but not finding anyone sharing their code or how to do it, Ive decided to release my own Neptune Exporter for Prometheus to the community. Go easy on me as it originally wasn't intended to be shared and was more for personal use. However now that Im releasing it to the masses I plan to support and grow it officially.

There are essentially 2 exporters in this release, but function as one. 1, is the exporter for the Neptune Apex on your network. 2, is for Neptune Fusion.
The reason to use Fusion data is because it has the Measurement Log data from the app. So if you log for example a Copper measurement in the Fusion App. That data will only live in Fusion. That is until you scrape the data into Prometheus.

The repo includes scripts that will guide the less Linux skilled community members through setting up necessary configuration files, and installation of all 3 softwares which Ive only tested it on Rocky 9 so far, but it should work on others like CentOS 7. It should include everything be the actual dashboard, but if there is enough demand I can make a how-to on creating dashboards with the data.

The GitHub repo for this is at https://github.com/dl-romero/neptune_exporter. Please refer there for documentations / how-to's.
I know this forum is preferred, but please Report Bugs and Submit Feature Requests at https://github.com/dl-romero/neptune_exporter/issues as it helps with tracking and prioritizing.

grafana.png


Cheers!

There are a couple repos out there that I recall. Not sure how much they get promoted but know there is a thread or two here as well as Neptune's forums. I personally use telegraf to grab the data and store into influx. Grafana is the presentation layer.
 
There are a couple repos out there that I recall. Not sure how much they get promoted but know there is a thread or two here as well as Neptune's forums. I personally use telegraf to grab the data and store into influx. Grafana is the presentation layer.

Do you run this on Synology?

Do you grab from each apex unit directly through XML file/URL or is this pulling from apexfusion.com instead?

I wish somebody took time to write a step by step for relative noobs.
 
Do you run this on Synology?

Do you grab from each apex unit directly through XML file/URL or is this pulling from apexfusion.com instead?

I wish somebody took time to write a step by step for relative noobs.
I swear I saw your name on the early apex threads for the aquabus library. I figured you were far from "noob"
 
Do you run this on Synology?

I do not, no. I'm not too familiar with the various Synology NAS storage units and their CPU and memory allocation for applications. Storage goes without saying obviously. I know some of the units allow the user to run applications so it may be possible. I do not have one though so can't say one way or the other. I have a Linux server in my lap that I use. It would also work on Windows. I would guess also on MacOS but again not tried that.

Do you grab from each apex unit directly through XML file/URL or is this pulling from apexfusion.com instead?

If there are unique Apex controllers, each with their own name and ip address, then yes. You would configure telegraf to poll, collect, each one. Data would be isolated based on the name and you could build dashboards accordingly.

I wish somebody took time to write a step by step for relative noobs.

It isn't complicated at 20,000 feet. It goes into the weeds when we start talking about installation across various Linux, Windows, MacOS OS versions or NAS devices. If one is comfortable running some basic cmd line commands it can be done.
 
There are a couple repos out there that I recall. Not sure how much they get promoted but know there is a thread or two here as well as Neptune's forums. I personally use telegraf to grab the data and store into influx. Grafana is the presentation layer.
Nice... Yea there were a couple repos, but none that I could get working. Plus IIRC they were designed pull data directly from the APEX. In any case I couldnt get them to work so I built the prometheus exporter from scratch. I started with pulling data directly from APEX Rest API, but I wanted more data that are baked into the APEX Fusion App... For example, the manual logging that is not done with a Trident. So I added the ability to interface directly with APEX Fusion Website as well. You can use either with the exporter I built. I also use Grafana display metrics, trends as well as alert out based on long term changes.


Glad to see im not the only nerd here haha
 
Back
Top
Home
Post thread…
Market
What's new






