Test Kits Using Phone RGB - Color Blind Testing Aid

PapaElf

Community Member
View Badges
Joined
Apr 7, 2020
Messages
26
Reaction score
79
Rating - 0%
0   0   0
Hi all. I've been a long time lurker getting lots of useful info off the forum to set up my first tank. I got some personal help last week with a fish diagnosis so I was looking for some way to give back to the community.

I am color blind which makes reading most test kits impossible. I have been using all Red Sea test kits. I can see the color change on the Alkalinity if I do 0.5 dkH increments but that is it. The rest I have are pink to blue color changes and I just can't see the red.

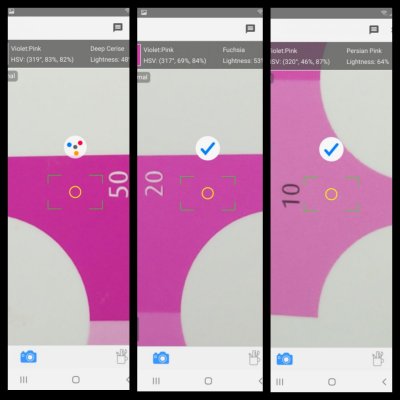
To get around this I use a phone app that takes the sensor color from a few pixels of the camera and outputs the RGB (Red, Green, Blue) values live on the screen. It will also do some translation of the RGB values and interpret them to a color name. My current phone is a Samsung Galaxy S8+ and the free App I have been using is called "Color Grab". The only issue I have had is that occasionally it seems like the colors on the phone will "shift" and aren't the values I expect for a given test. A phone reboot will usually fix this (and require a repeat test).

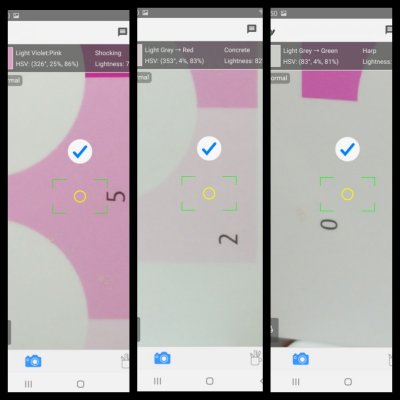
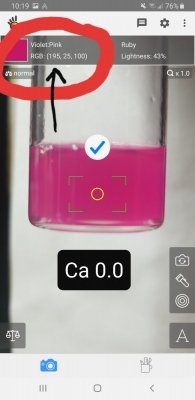
The screen grab of the app screen (with the large red circle in the top left) shows a target circle in the middle of the screen. It gives live value of the RGB (red, green, blue) values in the top left corner and a translated color name (Violet: Pink in this picture). For my tests I will watch the RGB values and wait for them to stabilize at each step.

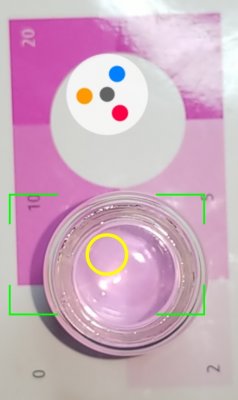
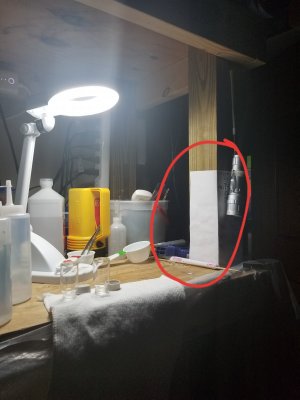
For a testing location I have a Harbor Freight magnifying light angled towards a white piece of paper on my work area that I use for a backdrop (there is a picture of this with a circle around the backdrop). Distance from the phone to the test piece is around 6-8 inches. The distance between the vial and the camera can effect the color so I try to maintain the same distance throughout the test and keep the dot on the same location on the vial. Sometimes the camera will have difficulty getting a good focus but this doesn't seem to effect the color (blue is blue whether in focus or not).

Disclaimer: there are some very detailed testing procedures on the forum where individuals mix up a solutions to a known value, do repeat testing, determine testing error, etc. This is not one of those. In my tests I pick a standard color threshold that I use to end my test. I feel I can repeat this value test to test. This allows me to target my parameters at a stable value, however, what I am calling calcium of 400 may actually be higher or lower than 400 depending on when you call the testing "done". I just try to make sure I am in the ball park of target values and then keep it stable. I would have to mix up known concentrations to get a true correlation. It is the same issue that someone trying to judge the color change would have. The methods could definitely be used to produce a more accurate absolute value with some care and testing because the color change can be quantified to a number.

Test method: I follow the standard test protocol for the test kit and then use the app for the final titration step. For the pictures shown I used a 0.02ml increment of titrant with 10 seconds of stirring/shaking per dose. I then wait 10-20 seconds for the RGB values to stabilize. It is important to hold the camera to vial distance relatively constant and to target the same spot on the sample. I don't have a test rig to hold the distance fixed, I just eyeball the size of the vial on the screen and try to keep it the same.

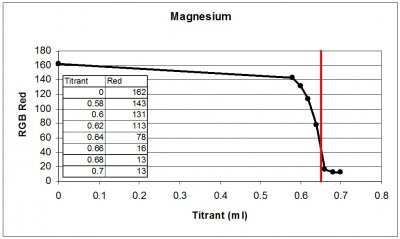
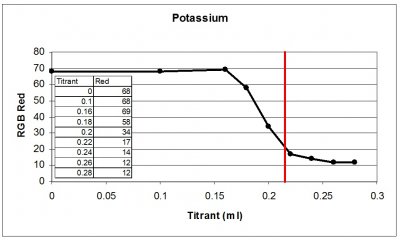
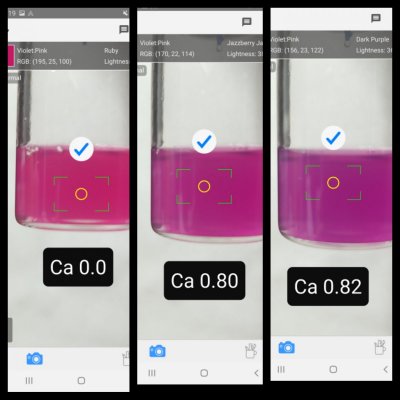
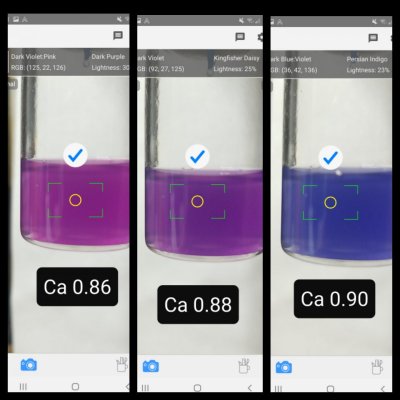
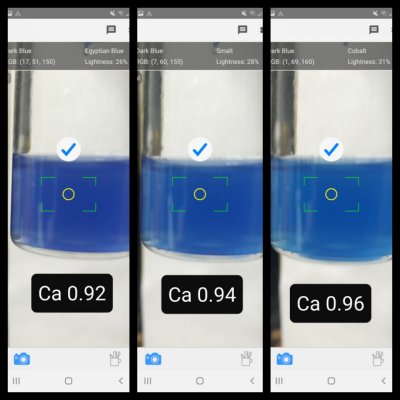
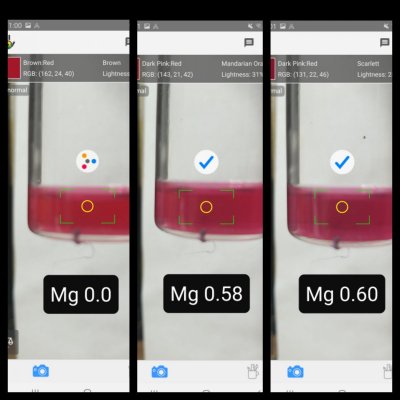
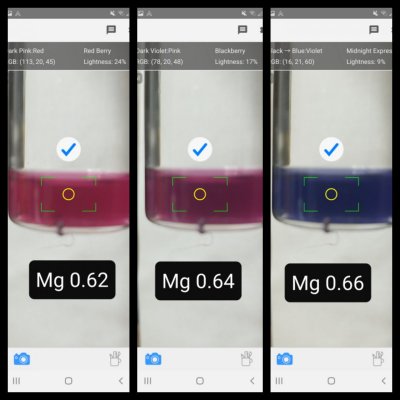
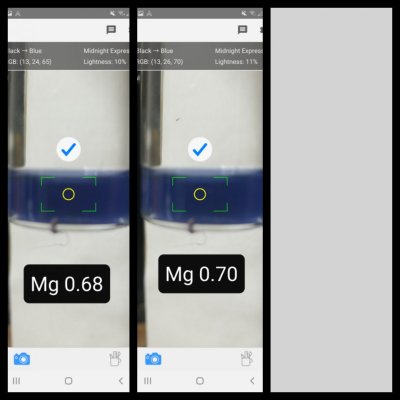
The tests shown below are Red Sea Pro Calcium, Magnesium, and Potassium tests. For each of these tests they change from a pink to blue color. I focus only on the Red value of the RGB (the first number) and use this to determine when my testing is complete.

I use the following thresholds to call my test complete:
Calcium: Red < 50
Magnesium: Red < 50
Potassium: Red < 20

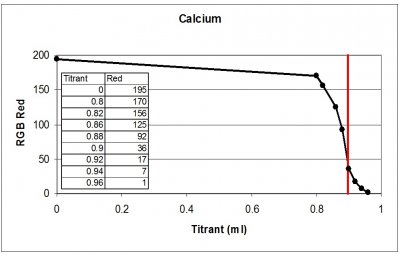
These values are towards the end of the steep part of the color change. Someone with more knowledge of the chemical reactions may be able to help me with what part of the curve to target for a more absolute value.

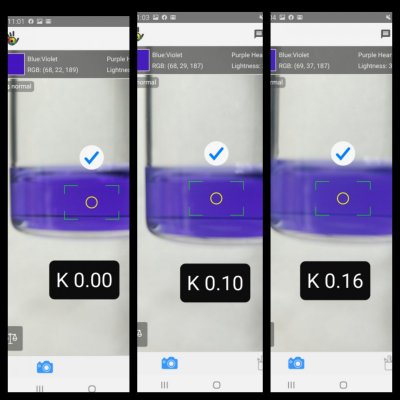
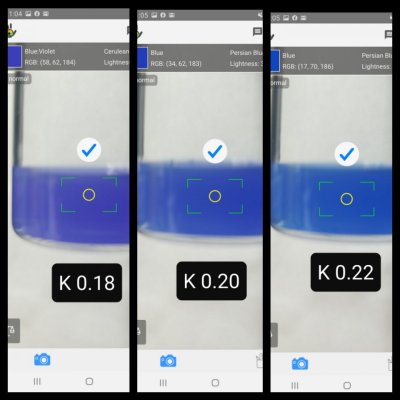
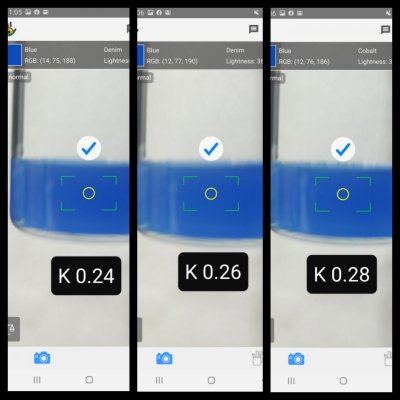
In the examples below for each test I have a plot of the amount of titrant added on the X-Axis with the Red value plotted on the Y-Axis. I also include a table of the values on the graph. For these three tests I would use a value of 0.9 for calcium (first test point with Red <50), 0.66 for Magnesium (first test point with Red <50), and 0.22 for Potassium (first test point with Red <20). From the test cards this gives me values of Calcium:450 , Magnesium:1320 , and Potassium:404.

Also included are select screen grabs of the vials during the tests. In these I have added the black box with the test (Ca for calcium, Mg for Magnesium, and K for Potassium) followed by the amount of titrant added for that picture.

Enjoy,

PapaElf
App.jpg Setup.jpg Calcium.jpg Magnesium.jpg Potassium.jpg Calcium1.JPG Calcium2.JPG Calcium3.JPG Magnesium1.JPG Magnesium2.JPG Magnesium3.JPG Potassium1.JPG Potassium2.JPG Potassium3.JPG
 

User

2500 Club Member
View Badges
Joined
Aug 15, 2017
Messages
4,523
Reaction score
7,476
Rating - 0%
0   0   0
Dude!!!

Real time CCD based colorimetric detection.

I've been using a super specialized equivalent in a lab setting for measuring suspensions of colour changing nanoparticles - they actually change color in response to how many specific bacterial cells they bind- but the machine is cumbersome and expensive.

I've been trying to figure out a way of doing this in a smaller format, and in a setting that doesn't require a lab.

And also with fast quantification of other suspensions that are relevant to aquarists.

I'll be trying this out in that application to see how it works.

Very cool
 

VJC

Community Member
View Badges
Joined
Aug 6, 2018
Messages
37
Reaction score
49
Location
Laguna Hills,
Rating - 0%
0   0   0
Great idea! I wonder if this will work to match the different shades of pink on the Red Sea nitrate test.
 

redfishbluefish

Stay Positive, Stay Productive
View Badges
Joined
Mar 22, 2012
Messages
11,704
Reaction score
25,719
Location
Sayreville, NJ
Rating - 0%
0   0   0
This is really neat.....loving it. I'm red-green colorblind, but can see the color change occur with the kits I have. Glad you shared this with the group.
 

taricha

5000 Club Member
View Badges
Joined
May 22, 2016
Messages
6,517
Reaction score
10,048
Rating - 0%
0   0   0
whoa. very nice demo!
I'll definitely play around with this.
tagging @Dan_P and @Rick Mathew
 

Rick Mathew

Valuable Member
View Badges
Joined
Mar 21, 2016
Messages
1,472
Reaction score
4,735
Location
North Central Florida
Rating - 0%
0   0   0
Hi all. I've been a long time lurker getting lots of useful info off the forum to set up my first tank. I got some personal help last week with a fish diagnosis so I was looking for some way to give back to the community.

I am color blind which makes reading most test kits impossible. I have been using all Red Sea test kits. I can see the color change on the Alkalinity if I do 0.5 dkH increments but that is it. The rest I have are pink to blue color changes and I just can't see the red.

To get around this I use a phone app that takes the sensor color from a few pixels of the camera and outputs the RGB (Red, Green, Blue) values live on the screen. It will also do some translation of the RGB values and interpret them to a color name. My current phone is a Samsung Galaxy S8+ and the free App I have been using is called "Color Grab". The only issue I have had is that occasionally it seems like the colors on the phone will "shift" and aren't the values I expect for a given test. A phone reboot will usually fix this (and require a repeat test).

The screen grab of the app screen (with the large red circle in the top left) shows a target circle in the middle of the screen. It gives live value of the RGB (red, green, blue) values in the top left corner and a translated color name (Violet: Pink in this picture). For my tests I will watch the RGB values and wait for them to stabilize at each step.

For a testing location I have a Harbor Freight magnifying light angled towards a white piece of paper on my work area that I use for a backdrop (there is a picture of this with a circle around the backdrop). Distance from the phone to the test piece is around 6-8 inches. The distance between the vial and the camera can effect the color so I try to maintain the same distance throughout the test and keep the dot on the same location on the vial. Sometimes the camera will have difficulty getting a good focus but this doesn't seem to effect the color (blue is blue whether in focus or not).

Disclaimer: there are some very detailed testing procedures on the forum where individuals mix up a solutions to a known value, do repeat testing, determine testing error, etc. This is not one of those. In my tests I pick a standard color threshold that I use to end my test. I feel I can repeat this value test to test. This allows me to target my parameters at a stable value, however, what I am calling calcium of 400 may actually be higher or lower than 400 depending on when you call the testing "done". I just try to make sure I am in the ball park of target values and then keep it stable. I would have to mix up known concentrations to get a true correlation. It is the same issue that someone trying to judge the color change would have. The methods could definitely be used to produce a more accurate absolute value with some care and testing because the color change can be quantified to a number.

Test method: I follow the standard test protocol for the test kit and then use the app for the final titration step. For the pictures shown I used a 0.02ml increment of titrant with 10 seconds of stirring/shaking per dose. I then wait 10-20 seconds for the RGB values to stabilize. It is important to hold the camera to vial distance relatively constant and to target the same spot on the sample. I don't have a test rig to hold the distance fixed, I just eyeball the size of the vial on the screen and try to keep it the same.

The tests shown below are Red Sea Pro Calcium, Magnesium, and Potassium tests. For each of these tests they change from a pink to blue color. I focus only on the Red value of the RGB (the first number) and use this to determine when my testing is complete.

I use the following thresholds to call my test complete:
Calcium: Red < 50
Magnesium: Red < 50
Potassium: Red < 20

These values are towards the end of the steep part of the color change. Someone with more knowledge of the chemical reactions may be able to help me with what part of the curve to target for a more absolute value.

In the examples below for each test I have a plot of the amount of titrant added on the X-Axis with the Red value plotted on the Y-Axis. I also include a table of the values on the graph. For these three tests I would use a value of 0.9 for calcium (first test point with Red <50), 0.66 for Magnesium (first test point with Red <50), and 0.22 for Potassium (first test point with Red <20). From the test cards this gives me values of Calcium:450 , Magnesium:1320 , and Potassium:404.

Also included are select screen grabs of the vials during the tests. In these I have added the black box with the test (Ca for calcium, Mg for Magnesium, and K for Potassium) followed by the amount of titrant added for that picture.

Enjoy,

PapaElf
App.jpg Setup.jpg Calcium.jpg Magnesium.jpg Potassium.jpg Calcium1.JPG Calcium2.JPG Calcium3.JPG Magnesium1.JPG Magnesium2.JPG Magnesium3.JPG Potassium1.JPG Potassium2.JPG Potassium3.JPG


Excellent project... nice write up . I have played around with one called "Color Blind Pal" works in a similar way. I only experience with the Salfert Mag test. Great job!
 

Dan_P

5000 Club Member
View Badges
Joined
Sep 21, 2018
Messages
6,643
Reaction score
7,127
Rating - 0%
0   0   0
Hi all. I've been a long time lurker getting lots of useful info off the forum to set up my first tank. I got some personal help last week with a fish diagnosis so I was looking for some way to give back to the community.

I am color blind which makes reading most test kits impossible. I have been using all Red Sea test kits. I can see the color change on the Alkalinity if I do 0.5 dkH increments but that is it. The rest I have are pink to blue color changes and I just can't see the red.

To get around this I use a phone app that takes the sensor color from a few pixels of the camera and outputs the RGB (Red, Green, Blue) values live on the screen. It will also do some translation of the RGB values and interpret them to a color name. My current phone is a Samsung Galaxy S8+ and the free App I have been using is called "Color Grab". The only issue I have had is that occasionally it seems like the colors on the phone will "shift" and aren't the values I expect for a given test. A phone reboot will usually fix this (and require a repeat test).

The screen grab of the app screen (with the large red circle in the top left) shows a target circle in the middle of the screen. It gives live value of the RGB (red, green, blue) values in the top left corner and a translated color name (Violet: Pink in this picture). For my tests I will watch the RGB values and wait for them to stabilize at each step.

For a testing location I have a Harbor Freight magnifying light angled towards a white piece of paper on my work area that I use for a backdrop (there is a picture of this with a circle around the backdrop). Distance from the phone to the test piece is around 6-8 inches. The distance between the vial and the camera can effect the color so I try to maintain the same distance throughout the test and keep the dot on the same location on the vial. Sometimes the camera will have difficulty getting a good focus but this doesn't seem to effect the color (blue is blue whether in focus or not).

Disclaimer: there are some very detailed testing procedures on the forum where individuals mix up a solutions to a known value, do repeat testing, determine testing error, etc. This is not one of those. In my tests I pick a standard color threshold that I use to end my test. I feel I can repeat this value test to test. This allows me to target my parameters at a stable value, however, what I am calling calcium of 400 may actually be higher or lower than 400 depending on when you call the testing "done". I just try to make sure I am in the ball park of target values and then keep it stable. I would have to mix up known concentrations to get a true correlation. It is the same issue that someone trying to judge the color change would have. The methods could definitely be used to produce a more accurate absolute value with some care and testing because the color change can be quantified to a number.

Test method: I follow the standard test protocol for the test kit and then use the app for the final titration step. For the pictures shown I used a 0.02ml increment of titrant with 10 seconds of stirring/shaking per dose. I then wait 10-20 seconds for the RGB values to stabilize. It is important to hold the camera to vial distance relatively constant and to target the same spot on the sample. I don't have a test rig to hold the distance fixed, I just eyeball the size of the vial on the screen and try to keep it the same.

The tests shown below are Red Sea Pro Calcium, Magnesium, and Potassium tests. For each of these tests they change from a pink to blue color. I focus only on the Red value of the RGB (the first number) and use this to determine when my testing is complete.

I use the following thresholds to call my test complete:
Calcium: Red < 50
Magnesium: Red < 50
Potassium: Red < 20

These values are towards the end of the steep part of the color change. Someone with more knowledge of the chemical reactions may be able to help me with what part of the curve to target for a more absolute value.

In the examples below for each test I have a plot of the amount of titrant added on the X-Axis with the Red value plotted on the Y-Axis. I also include a table of the values on the graph. For these three tests I would use a value of 0.9 for calcium (first test point with Red <50), 0.66 for Magnesium (first test point with Red <50), and 0.22 for Potassium (first test point with Red <20). From the test cards this gives me values of Calcium:450 , Magnesium:1320 , and Potassium:404.

Also included are select screen grabs of the vials during the tests. In these I have added the black box with the test (Ca for calcium, Mg for Magnesium, and K for Potassium) followed by the amount of titrant added for that picture.

Enjoy,

PapaElf
App.jpg Setup.jpg Calcium.jpg Magnesium.jpg Potassium.jpg Calcium1.JPG Calcium2.JPG Calcium3.JPG Magnesium1.JPG Magnesium2.JPG Magnesium3.JPG Potassium1.JPG Potassium2.JPG Potassium3.JPG
Clever, clever, clever!

Thanks for the pictures. You put a bunch of work into this post.

If only we could just add reagent, measure the color and call the concentration. No more titrations!
 
OP
OP
PapaElf

PapaElf
Community Member
View Badges
Joined
Apr 7, 2020
Messages
26
Reaction score
79
Rating - 0%
0   0   0
Great idea! I wonder if this will work to match the different shades of pink on the Red Sea nitrate test.

So VJC asked the question as to whether this could be adapted to the Red Sea Nitrate test. I know I had looked in the past for a "Hanna" like nitrate kit that reads a value but came up blank.

For proof of concept I used the test card for the red sea nitrate kit. After a couple of sample pictures I did some reading on interpolating colors. Learned this is easier done using an HSV color map rather than RGB. Color Grab has an option to display HSV so I sampled the test card using HSV.

A quick Wikipedia on HSV (Hue, Saturation, Value) shows that it represents the color map like a cylinder. My interpretation of this is Hue is the color going from 0 to 360 degrees, Saturation is various tints of the color from 0 to 100%, and Value being a mix of the color with black to white 0 to 100% (not an expert on this).

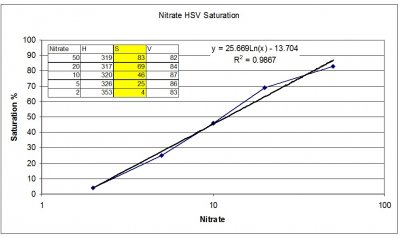
So I put the HSV values into excel and plotted them up. The table of values is buried in the graph. Hue stays fairly constant around 320, Value is around 85, and the saturation varies nicely. I converted the Nitrate axis to a log scale and it produces a nice linear fit to the Saturation. So I would say yes, a numerical Nitrate test is possible.

One note that on the log scale you can't plot a zero point. I think White can also be represented many different ways on HSV so the correlation breaks down at white anyway. Using the curve fit the lowest Nitrate value of the curve fit (at zero saturation) would be a Nitrate of 1.7 as the lower limit.

Another note that the card and the test vials read differently even when the are "matched". The way to do this would be to mix up the sample nitrate concentrations, repeat the test with the vials, and then see how well of a curve fit you get with actual samples.

Nitrate.jpg Nitrates_50_20_10.JPG Nitrates_5_2_0.JPG
 

taricha

5000 Club Member
View Badges
Joined
May 22, 2016
Messages
6,517
Reaction score
10,048
Rating - 0%
0   0   0
Just to point out why this is great...
Our other automated eyeballs do a good job at quantifying color on test kits of the form "do reagent stuff, wait X minutes, compare to color card" but they have some shortcomings when it comes to titrations.
The hanna checkers do not give "live" readings, and the spectrometers I'm familiar with require a tiny volume < 3mL that is impractical for hobby test kit titrations.

I tried this on Color Grab a pic I had of a series of pink NO3 tests next to color card. The saturation part of HSV does a nice job of placing the samples relative to the color card. And it's mush less sensitive to bright spots and shadows than I expected.
Very cool!

BTW, even for eyes that are quite normal, those pics of the color "change" in the K test kit, yikes!
 

dvlpr

Active Member
View Badges
Joined
Feb 18, 2020
Messages
206
Reaction score
321
Location
Melbourne, Australia
Rating - 0%
0   0   0

Dan_P

5000 Club Member
View Badges
Joined
Sep 21, 2018
Messages
6,643
Reaction score
7,127
Rating - 0%
0   0   0
So VJC asked the question as to whether this could be adapted to the Red Sea Nitrate test. I know I had looked in the past for a "Hanna" like nitrate kit that reads a value but came up blank.

For proof of concept I used the test card for the red sea nitrate kit. After a couple of sample pictures I did some reading on interpolating colors. Learned this is easier done using an HSV color map rather than RGB. Color Grab has an option to display HSV so I sampled the test card using HSV.

A quick Wikipedia on HSV (Hue, Saturation, Value) shows that it represents the color map like a cylinder. My interpretation of this is Hue is the color going from 0 to 360 degrees, Saturation is various tints of the color from 0 to 100%, and Value being a mix of the color with black to white 0 to 100% (not an expert on this).

So I put the HSV values into excel and plotted them up. The table of values is buried in the graph. Hue stays fairly constant around 320, Value is around 85, and the saturation varies nicely. I converted the Nitrate axis to a log scale and it produces a nice linear fit to the Saturation. So I would say yes, a numerical Nitrate test is possible.

One note that on the log scale you can't plot a zero point. I think White can also be represented many different ways on HSV so the correlation breaks down at white anyway. Using the curve fit the lowest Nitrate value of the curve fit (at zero saturation) would be a Nitrate of 1.7 as the lower limit.

Another note that the card and the test vials read differently even when the are "matched". The way to do this would be to mix up the sample nitrate concentrations, repeat the test with the vials, and then see how well of a curve fit you get with actual samples.

Nitrate.jpg Nitrates_50_20_10.JPG Nitrates_5_2_0.JPG
I can confirm this. I did a similar exercise and was using the iPad camera to “read” the nitrate color for the Red Sea nitrate test.
 

New&no clue

2500 Club Member
View Badges
Joined
May 11, 2019
Messages
3,542
Reaction score
12,174
Rating - 0%
0   0   0
This is amazing. I'm not color blind... but I have a really hard time reading test kits. I complain about it regularly. Thanks for post this I will have to try it out.
 

taricha

5000 Club Member
View Badges
Joined
May 22, 2016
Messages
6,517
Reaction score
10,048
Rating - 0%
0   0   0
Is this an app? I would like to try it
yep. see here...
My current phone is a Samsung Galaxy S8+ and the free App I have been using is called "Color Grab".

Just to add on to this - I've been using Aquarium Note
I've also used that app. I think I like the Color Grab discussed in this thread. It has way more options for details of how to quantify color, and it seems the HSV method is less sensitive to shadows/light than the Aquarium Note.
(but Aquarium Note is a simpler interface. 3 color selectors, two on the color cards, one on the test sample.)
 
OP
OP
PapaElf
PapaElf
Community Member
View Badges
Joined
Apr 7, 2020
Messages
26
Reaction score
79
Rating - 0%
0   0   0
Just to add on to this - I've been using Aquarium Note (https://play.google.com/store/apps/details?id=com.dyhwang.aquariumnote&hl=en_AU) since I started this hobby with a FW tank just over a year ago and it also allows to take photos of the test tubes and the chart and then you can match the values. This is what it looks like roughly (from their site) - https://lh3.googleusercontent.com/F...8P3QtMXnrq0fCGeGy8Z_J7dFuMw6ZTDZcE=w1920-h944


I remember trying that app in the past but I couldn't remember why I went away from it. I took an overhead pictures today and then I remembered why. I attached one of my pictures. In that app you take an overhead picture, then pick a sample point on the vial, and then on the two closest colors on the card and it will interpolate your color to the neighboring colors on the card. With my lighting I get a lot of reflection from the light and a lot of shadows, light spots, and dark spots. I didn't know where to pick on my sample and if I picked different spots I could get different results. never could get a decent picture with uniform lighting. (As I try doing Nitrates with my phone I am still having some of those same difficulties).

Thanks for sharing.

Overhead_Nitrate.jpg
 
OP
OP
PapaElf
PapaElf
Community Member
View Badges
Joined
Apr 7, 2020
Messages
26
Reaction score
79
Rating - 0%
0   0   0
So Saturday is testing day. I was thinking about a couple of things over the week that I wanted to apply to get things tuned in a little better.

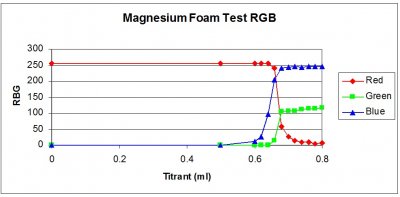
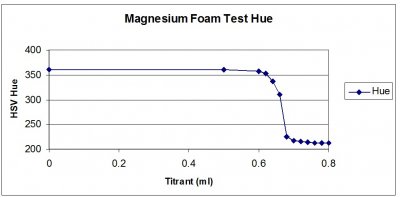
The first thing was using the RGB color map versus the HSV color map. In my previous tests I focused on the Red component of RGB values out of necessity. There is a graph below called "Magnesium Foam Test RGB" that plots the Red, Green, and Blue components during a test. Each color has different starting and ending points of it's color change. I just happened to choose Red which had the largest change. In the HSV color map the color is contained in the Hue value that goes in a circle from 0 to 360 degrees. This gives a single value that is easy to focus on. It is Red at 0 degrees, transitioning to Green at 120 degrees, to Blue and 240 degrees and then back to Red at 360 degrees (the same as 0 degrees). The second graph "Magnesium Foam Test Hue" plots the Hue on an identical sample to the RGB plot. It starts at Red at 360 and transitions to an end point at 210 which is on the green side of blue (pure blue at 240). Going forward I am going to focus on using Hue rather than Red in my previous tests. It is a single value to focus on and also tends to give a sharper transition to its end value.

I also figured out on the Color Grab app how to display both HSV and RBG at the same time so those are included in my screen grabs going forward. HSV in the top left and RGB in the top right.

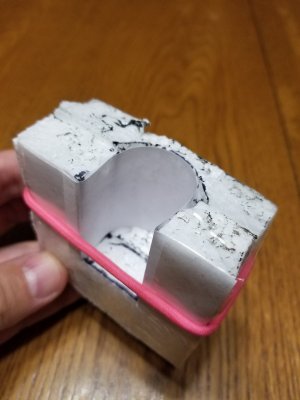
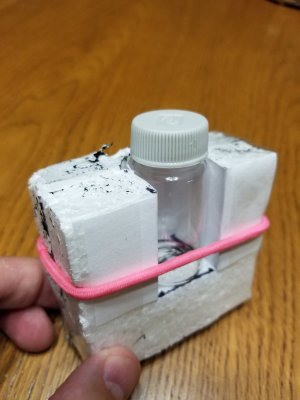
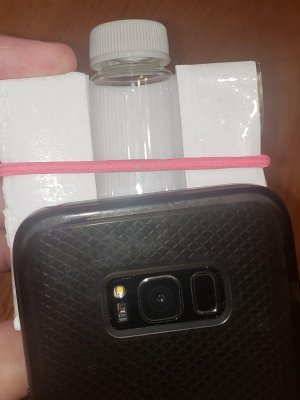
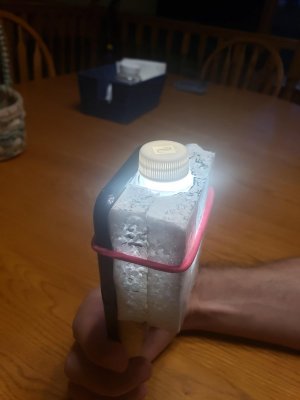
Finally I was bothered by the fact that I knew the colors changed in my previous method as the phone got closer or further from the sample. To fix this I made a small foam attachment that holds the vial right against the camera on my phone. I used 2 pieces of foam (leftovers from the sheet I set my tanks on), carved them out for the vial, and then just taped them together. I taped a white piece of paper in as a background to provide a uniform back drop. The width of the opening is also wide enough such that when it is attached to the phone the camera lens and the flash or flashlight are both exposed. In the Color Grab app is an option to turn the flashlight on and this lights the sample up nicely. A rubber band holds the foam and sample to the phone.

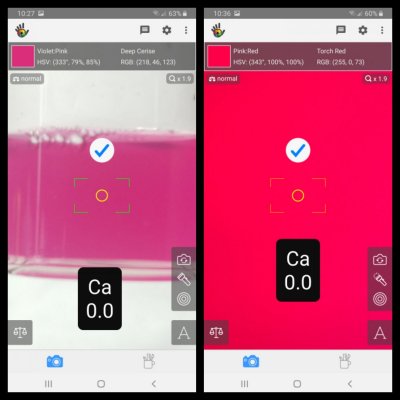
The final picture is a side by side of a Calcium test with 0 titrant added taken from a distance and then close up with the foam piece. This demonstrates how the color changes with distance from the camera. The close up foam sample shows up as much more red than the typical pink starting point.

One last note on the foam phone adapter with flashlight. For very opaque samples like the Calcium test it works great because the color shows as very uniform. For more transparent tests like Alkalinity (I will post an alkalinity test shortly) there is an obvious reflection from the flashlight. You have to move the Color Grab sample point to avoid this bright reflection. I also keep playing around with Nitrates which are very transparent. The transparent samples show the flashlight and multiple reflections that cause a very non-uniform color pattern. So still easy to do a titration but hard to get a consistent absolute value. I will get more into the nitrate test later.

Following I have tests for Alkalinity, Calcium, and Magnesium that I will post with back to back comparisons. Plus some additional attempts at Nitrates. I will start posting these one at a time as separate posts. Potassium will have to wait. I only check that once a month.

RGB.jpg Hue.jpg foam1.jpg foam2.jpg foam4.jpg foam3.jpg Compare.JPG
 

Rick Mathew

Valuable Member
View Badges
Joined
Mar 21, 2016
Messages
1,472
Reaction score
4,735
Location
North Central Florida
Rating - 0%
0   0   0
Very Clever!!..Looking forward to the rest of your work
 
OP
OP
PapaElf

PapaElf

Community Member
View Badges
Joined
Apr 7, 2020
Messages
26
Reaction score
79
Rating - 0%
0   0   0
First test up today is Red Sea Alkalinity.

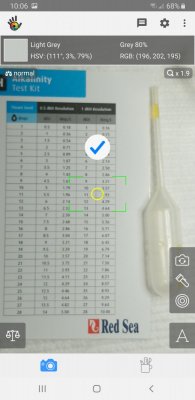
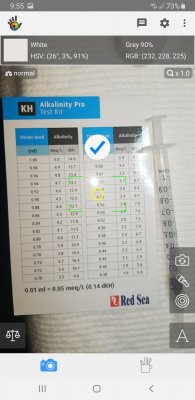
I started reefing with a Red Sea mixed test kit that had a dropper for alkalinity. In a 10ml water sample each drop is equal to 0.5 dkh. 18 drops would be a dkh of 9.0. I later got a Red Sea Pro Alkalinity test with a syringe, however, at the 0.02ml increments I couldn't see the smaller color changes clear enough so I went back to the simpler and lower resolution dropper kit. I pulled out both the dropper and the syringe yesterday and did back to back tests. The dropper had me at 9.0dkh with the syringe at 7.4 (I target 9.0). Big difference. I got on the BRS calculator and calculated the addition to ramp back up to 9.0 and started adding this over a couple of days. I have a few more doses to add. This morning I repeated the back to back and captured some screen grabs on the way.

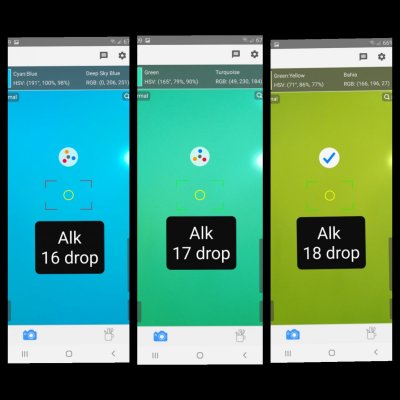
For both of these tests I used my foam phone adapter and monitored the Hue from the HSV color set (the first of the three values: Hue, Saturation, Value) using the Color Grab phone app. The alkalinity colors are fairly transparent and that leaves a bright reflection on the screen from the flashlight on the phone (turned on) so I made sure that this wasn't near the sampling circle. The color is pretty uniform away from this glare spot and when you drop the vial back in it hits the same spot every time.

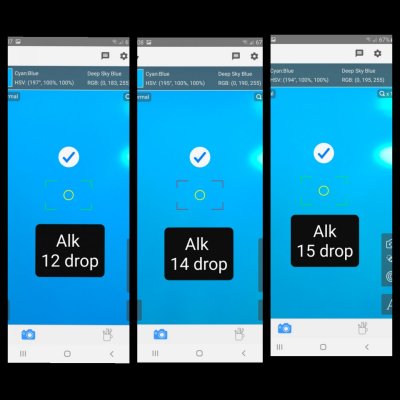
For the plot of Hue vs Drops the color transition starts at 16 drops and I am calling 18 complete for a dkh of 9.0. The corresponding screen grabs showing the colors are also included (this is the series of pictures labeled in drops added) and the HSV values and RGB are in the top left and top right corners.

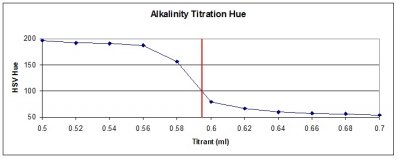
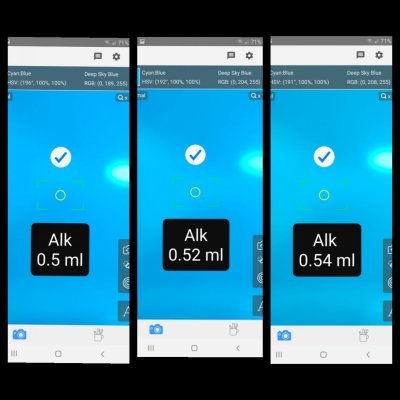
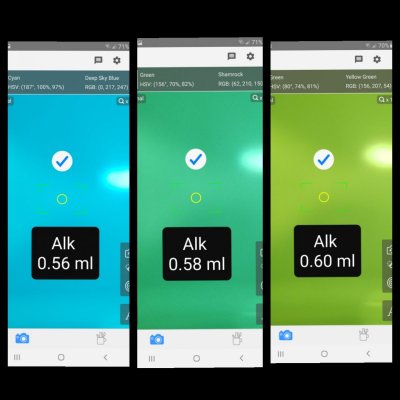
In the plot of Hue vs Titration (this is using the syringe) the color transition starts at 0.56 and I am calling 0.6 done for a dkh of 8.4. Closer result between the two methods than yesterday. I added alkalinity over the last two days so I expected the value to be higher than the previous 7.4. Looking at the color pictures (this is the series labeled in ml added) with this setup I can see the color change much more clearly that when I watch it "live" in the vial. Again the HSV and RGB values are available on the plots.

Of the two methods I trust the Pro kit with the syringe more as you get a measured value of the material added. It's hard to say how consistent a drop is from dropper to dropper.

I will use the Pro kit going forward with my foam phone adapter and monitor the Hue. Looking at the curve I will use a cutoff Hue value of 100 (call the test done at the test point where the Hue drops below 100). Looking at the slope of the curve I should be able to repeat this within 0.01ml.

Will follow up with the Calcium test next.

Dropper.jpg Titration.jpg Alk_plot_dropper.jpg Alkalinity_Drops_1.JPG Alkalinity_Drops_2.JPG Alk_plot_titration.jpg Alkalinity_Titrate_1.JPG Alkalinity_Titrate_2.JPG
 

Fusion in reefing: How do you feel about grafted corals?

  • I strongly prefer grafted corals and I seek them out to put in my tank.

    Votes: 3 3.8%
  • I find grafted corals appealing and would be open to having them in my tank.

    Votes: 46 57.5%
  • I am indifferent about grafted corals and am not enthusiastic about having them in my tank.

    Votes: 23 28.8%
  • I have reservations about grafted corals and would generally avoid having them in my tank.

    Votes: 5 6.3%
  • I have a negative perception and would avoid having grafted corals in my tank.

    Votes: 3 3.8%
Back
Top