

For a lot more information about corals, maintaining growth and color check out our new page here Orphek News
Our eyes have photoreceptors that sense different wavelengths representing colors. They are sensitive to short, medium, and high nanometer wavelengths (420-440, 530-540, and 560-580). Corals also have similar receptors and positively react to intensity and wavelengths in the PUR spectrum which is 400-550 and 620-700nm.
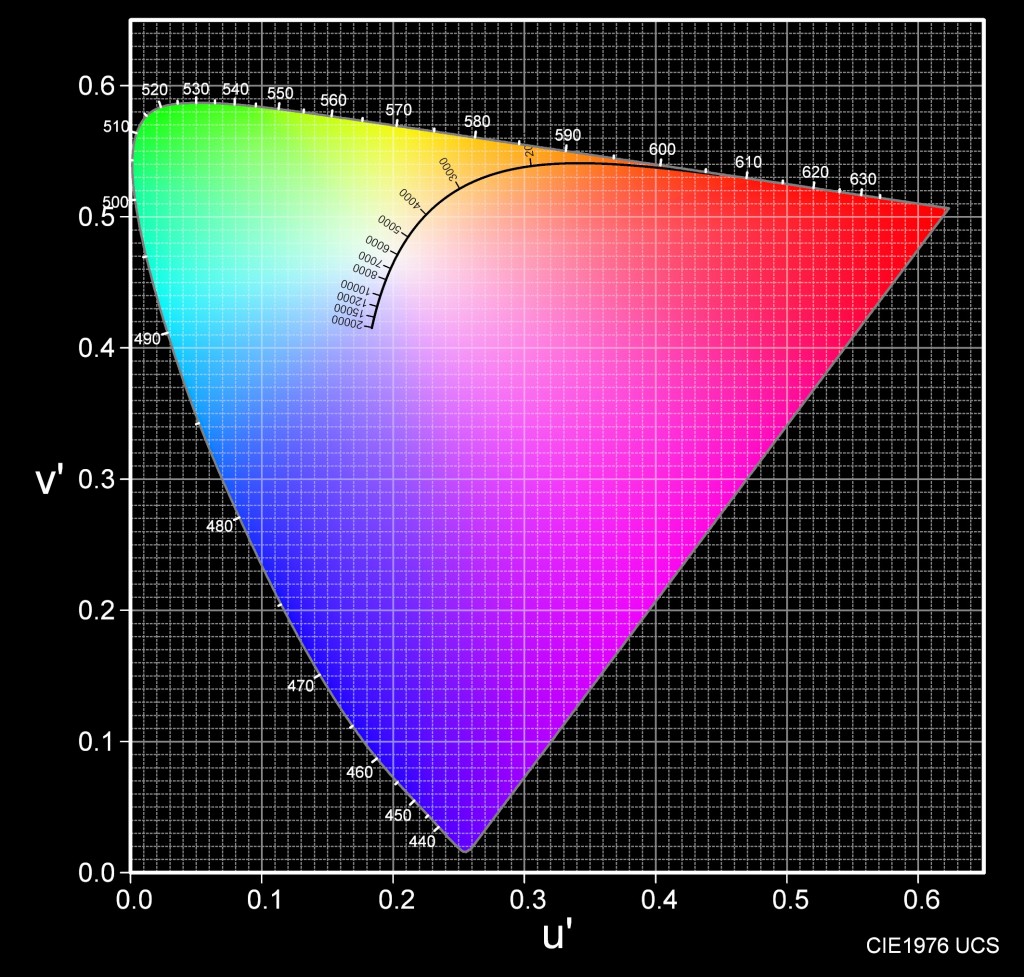
CHROMATICITY Chart
Orphek’s design team uses spectrographs generated by a spectrometer and most importantly, a CIE RGB color chromaticity chart. This chart maps a range of physically produced colors as well as the intensity of the colors. Without a chromaticity chart or map, a spectrograph alone is not useful. Orphek uses both for a meaningful report of their LEDs ability to produce light corals positively respond to.
The chromaticity chart maps a full plot of all visible colors and is divided into two parts; brightness and chromaticity The color white is considered a bright color while grey is generally considered to be a less bright version of that same white.
The CIE XYZ RGB color space is designed and read so that the “Y†parameter is a measure of brightness or luminance of a color. X is a mix (a linear combination) of cone response curves. The chromaticity of a color is then specified by the parameters x and y. If you choose any two points of color on the chromaticity chart, then all the colors that lie in a straight line between the two points can be formed by mixing these two colors. The total amount of colors must be convex in shape and all the colors that can be formed by mixing these sources are found inside the triangle which is formed by the source points as shown below.
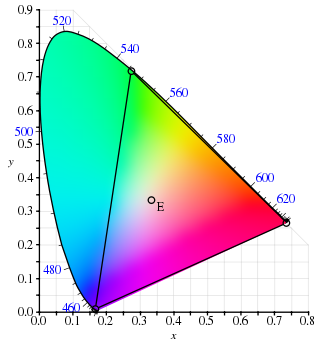
If one chooses any two points of color on the chromaticity diagram, then all the colors that lie in a straight line between the two points can be formed by mixing these two colors. It follows that the gamut of colors must be convex in shape. All colors that can be formed by mixing three sources are found inside the triangle formed by the source points on the chromaticity diagram.
As you can see by Orphek’s CHROMATICITY chart of their LEDs, all colors needed by colors are formed as well as the intensity required for good growth.
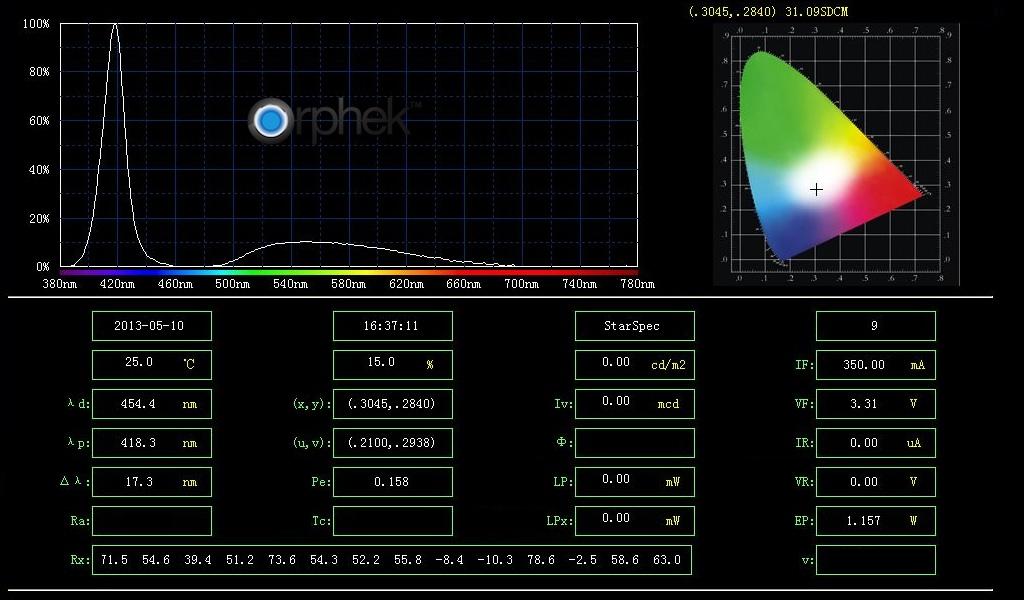
It is very important when choosing LED lights for your reef tank to view the manufacturer’s spectrograph as well as their CHROMATICITY chart on their product. It is equally important to see if any there is any change in the spectrum when dimming the LEDs. Changing spectrum in a dimming mode is not good for corals and Orphek LED technology maintains the spectrum in the dimming mode.

Our eyes have photoreceptors that sense different wavelengths representing colors. They are sensitive to short, medium, and high nanometer wavelengths (420-440, 530-540, and 560-580). Corals also have similar receptors and positively react to intensity and wavelengths in the PUR spectrum which is 400-550 and 620-700nm.
CHROMATICITY Chart
Orphek’s design team uses spectrographs generated by a spectrometer and most importantly, a CIE RGB color chromaticity chart. This chart maps a range of physically produced colors as well as the intensity of the colors. Without a chromaticity chart or map, a spectrograph alone is not useful. Orphek uses both for a meaningful report of their LEDs ability to produce light corals positively respond to.
The chromaticity chart maps a full plot of all visible colors and is divided into two parts; brightness and chromaticity The color white is considered a bright color while grey is generally considered to be a less bright version of that same white.
The CIE XYZ RGB color space is designed and read so that the “Y†parameter is a measure of brightness or luminance of a color. X is a mix (a linear combination) of cone response curves. The chromaticity of a color is then specified by the parameters x and y. If you choose any two points of color on the chromaticity chart, then all the colors that lie in a straight line between the two points can be formed by mixing these two colors. The total amount of colors must be convex in shape and all the colors that can be formed by mixing these sources are found inside the triangle which is formed by the source points as shown below.
If one chooses any two points of color on the chromaticity diagram, then all the colors that lie in a straight line between the two points can be formed by mixing these two colors. It follows that the gamut of colors must be convex in shape. All colors that can be formed by mixing three sources are found inside the triangle formed by the source points on the chromaticity diagram.
As you can see by Orphek’s CHROMATICITY chart of their LEDs, all colors needed by colors are formed as well as the intensity required for good growth.
It is very important when choosing LED lights for your reef tank to view the manufacturer’s spectrograph as well as their CHROMATICITY chart on their product. It is equally important to see if any there is any change in the spectrum when dimming the LEDs. Changing spectrum in a dimming mode is not good for corals and Orphek LED technology maintains the spectrum in the dimming mode.


