



reef-pi :: An opensource reef tank controller based on Raspberry Pi.

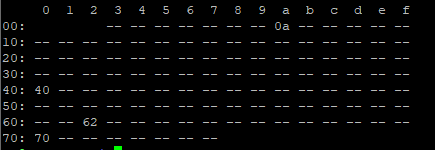
Yep, I've got one temp probe running. i2cdetect included below for reference:
1607612462454.png

Hi arbiter42, that error means the I2C address in the driver can't be found on the Pi. The default should have been 99 but I see by the i2cdetect its 98. I guess I forgot to change it back before programming it. Try changing the I2C address for the pH driver, after doing so go to "admin" tab and press "reload", then open the pH calibration screen and you should get a reading.

The clock stretching is required only for my circuit because it doesn't use an ADC chip instead it has an ATtiny85 and it requires I2C stretching, at least at my level. That hack slows down the I2C bus so it's not a problem. You would get parse errors if that wasn't setup.

 
Hi arbiter42, that error means the I2C address in the driver can't be found on the Pi. The default should have been 99 but I see by the i2cdetect its 98. I guess I forgot to change it back before programming it. Try changing the I2C address for the pH driver, after doing so go to "admin" tab and press "reload", then open the pH calibration screen and you should get a reading.

The clock stretching is required only for my circuit because it doesn't use an ADC chip instead it has an ATtiny85 and it requires I2C stretching, at least at my level. That hack slows down the I2C bus so it's not a problem. You would get parse errors if that wasn't setup.
Oops , supposed to be 98 not 88. Thank you @robsworld78 . Hexadecimal :-) 6*16 +2. Can’t believe I messed that up,

Make sure to to reload reef-pi after every driver changes
 
I have a question for Ranjib. In your picture above you have your dashboard set up with meters instead of the graph, how could i set mine up like that.
 
most of the things you have mentioned should be logged as well as emitted as metrics. i,e. reef-pi logs as well as emits metric every time outlet state is changed. subsystem enable/disable (like enabling a specific timer) is only logged, if they do change equipment state, that will have log /metric trail as well. let me know if you need help with verifying any of these.

We can extend the telemetry sub-systems to include anything more sophisticated. I have some plans to accommodate metric backend (Adafruit, mqtt, Prometheus) specific nuances.. I can roll in anything relevant from event integration there.
I thought this should be the case, but I am not getting anything in the logs. Running version 4.0 now and its blank. Let me run some routines and see if something pops up.
 
Hi arbiter42, that error means the I2C address in the driver can't be found on the Pi. The default should have been 99 but I see by the i2cdetect its 98. I guess I forgot to change it back before programming it. Try changing the I2C address for the pH driver, after doing so go to "admin" tab and press "reload", then open the pH calibration screen and you should get a reading.

The clock stretching is required only for my circuit because it doesn't use an ADC chip instead it has an ATtiny85 and it requires I2C stretching, at least at my level. That hack slows down the I2C bus so it's not a problem. You would get parse errors if that wasn't setup.

That did it! Thanks @robsworld78 and @Ranjib.
 
If you really like charts , please go for it. Its amazing. You can have a Pi 3/4 or even zero running prometheus and grafana (its as simple as the initial reef-pi installation), but it will open up the whole lot of metrics /charting possibilities. You will not regret. It will take some time, but hey so does this hobby, and we are here to help you out.
Grafana /Prometheus is what the big tech companies use , these tool are absolutely stellar. I get to see my 50+ pi metrics, their health, different sensors, behavior of ATO/temperature controller and much more. All charting customizations (boundary values, colors, graph style) are at your finger tip.
I work for a Internet security company and our infrastructure team use Prometheus/Grafana to monitor our CA operations, so I reached out to them and they are pretty interested to here what I am doing with RPI and they offered to help me get up to speed, WooHoo!!!! Getting pretty exited to get started... Here's my cobbled together AIO dashboard so far, useful for now showing the important stuff that I can. Values are all over the place as the RPI is still on the work bench.
 

Attachments

  • AIO Dashboard.JPG
    AIO Dashboard.JPG
    161.5 KB · Views: 119
I have a question for Ranjib. In your picture above you have your dashboard set up with meters instead of the graph, how could i set mine up like that.
It’s a grafana dashboard and not reef-pi. For this you have to setup Prometheus for metric storage , and configure reef-pi to emit Prometheus metrics. Then install grafana (dashboard software) and configure it to use Prometheus for data, and then you can do any type of charts in any color , size etc
 
I thought this should be the case, but I am not getting anything in the logs. Running version 4.0 now and its blank. Let me run some routines and see if something pops up.
Please do and let us know. You can see the log of reef-pi using journalctl command

 
It’s a grafana dashboard and not reef-pi. For this you have to setup Prometheus for metric storage , and configure reef-pi to emit Prometheus metrics. Then install grafana (dashboard software) and configure it to use Prometheus for data, and then you can do any type of charts in any color , size etc
Is there a tutorial on how to do that?
 
Is there a tutorial on how to do that?
Just search for how to “how to install grafana /Prometheus on pi” and that should lead to loads of tutorials. Once installed, configure grafana to use Prometheus and configure Prometheus to scrape metrics from reef-pi.
Let us know when you are done with the installations , I can walk through the step for last part (Prometheus -reef pi configuration )
 
Something to remember these tools (grafana /Prometheus) can take up significant resources and I don’t recommend running them on the same pi where reef-pi is running.
 
With 4.0 we have shipped a long running asynchronous job runner , something that allows us to do reef-pi upgrades from ui. I am hoping we can reuse that system to add features like this (let users install grafana /Prometheus from reef-pi ui itself)
 
Something to remember these tools (grafana /Prometheus) can take up significant resources and I don’t recommend running them on the same pi where reef-pi is running.
@Ranjib Ah! I installed them on my Pi 3b+ where I'm running Reef-Pi. Enabled Prometheus in settings and now the UI will not load, just shows "Loading" in the browser. :(
 
Last edited:

TOP 10 Trending Threads

ARE YOU READY TO CONFESS TO CRAZIEST, DUMBEST, FUNNIEST THING YOU’VE EVER DONE IN REEFING?

  • Yeah, I'll confess! (Share your story in the comments!)

    Votes: 34 54.8%
  • Nah, I'll keep mine a secret...(Don't be like that, share with the class!)

    Votes: 28 45.2%
Back
Top
Home
Post thread…
Market
What's new









