Trying out a new spectrometer

OP
OP
AKReefing

AKReefing

Active Member
View Badges
Joined
Nov 29, 2023
Messages
350
Reaction score
321
Location
Fairbanks
Rating - 0%
0   0   0
I borrowed my old PARwise to make measurements of the UV lamp outout and merged those measurements with some blue LEDs I have laying around. PARwise didn't fare so well.

Based on the measurements I mada using the Spectryx against a white fluorescent bulb, and against a UV sterilization lamp, I'm comfident in my Spectryx's accuracy between 400 and 700 nanometers. Using the Spectryx as a validated reference, you can see the differences between the reference and PARwise. As you go from 440nm toward UV, PARwise reads increasingly lower wavelengths. Above 448nm, it can't be trusted at all, apparently.

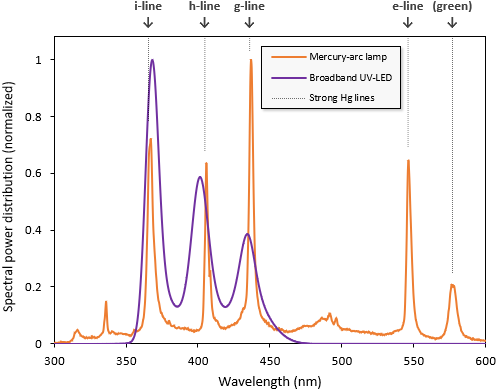
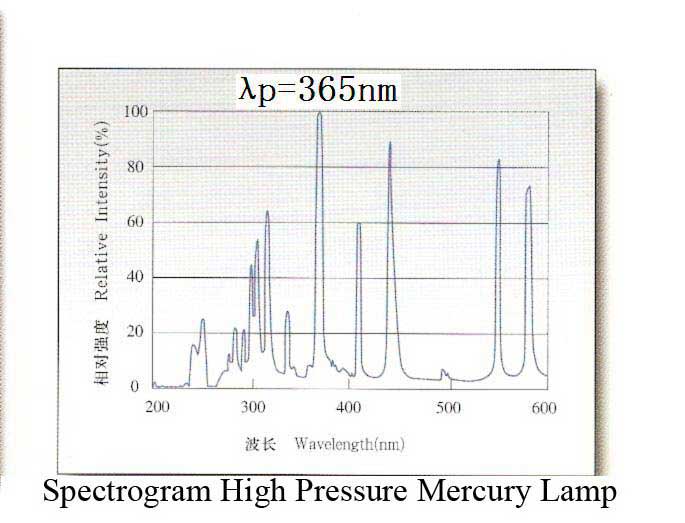
The second issue with PARwise is that when measuring the UV lamp it couldn't identify any UV peaks as narrow band, or even detect one at all (405nm). Spectryx was definitely able to identify 4 of them precisely.

The table shows readings of single LEDs and 4 UV peaks from the UV lamp. Yellow cells identify the measurements that were close to the reference. Consider the Spectrix readings as "truth", or close to it.

So in my personal experience and opinion, PARwise has no value when it comes to measuring spectrum. If you remove the pretty colors it's fairly obvious.

Presentation1.jpg
 
Last edited:

luxdium

Community Member
View Badges
Joined
Apr 17, 2022
Messages
87
Reaction score
102
Location
SF Bay Area, California, United States
Rating - 0%
0   0   0
So what do you think about my UV measurements above?
The peaks are accurate enough, though I do see some noise between them. Perhaps from autofluorescence within the fiber optic. This could explain why that CFL bulb had a wider green band than expected.

If you export the data to a spreadsheet, you'll know precisely how much your meter varies from the standard.
 
OP
OP
AKReefing

AKReefing

Active Member
View Badges
Joined
Nov 29, 2023
Messages
350
Reaction score
321
Location
Fairbanks
Rating - 0%
0   0   0
The second scan shows the green region with much better resolution, probably because I held the end of the fiber several feet from the source. Thr first scan was an inch from the bulb, which may have saturated the analyzer. But as I said, green is not something I care about anyway.

As far as noise, it's weak enough to be considered a non-issue for my purposes.

I'll see if the app has the capability to export. If not, it's still more than adequate for my purposes: It accurately identifies peaks, the measurements are consistent, and the resolution is impressive. Do I need nanometer precision? No, although it gives me the impression that the unit I have may be that accurate within the visual spectrum. I'm not a scientist, so for $200 I managed to get a tool that, surprisingly, manages to do everything I need it to do.
 

luxdium

Community Member
View Badges
Joined
Apr 17, 2022
Messages
87
Reaction score
102
Location
SF Bay Area, California, United States
Rating - 0%
0   0   0
The second scan shows the green region with much better resolution, probably because I held the end of the fiber several feet from the source. Thr first scan was an inch from the bulb, which may have saturated the analyzer. But as I said, green is not something I care about anyway.

As far as noise, it's weak enough to be considered a non-issue for my purposes.

I'll see if the app has the capability to export. If not, it's still more than adequate for my purposes: It accurately identifies peaks, the measurements are consistent, and the resolution is impressive. Do I need nanometer precision? No, although it gives me the impression that the unit I have may be that accurate within the visual spectrum. I'm not a scientist, so for $200 I managed to get a tool that, surprisingly, manages to do everything I need it to do.

You should be fine if you're within 2 or 3nm. Chasing nm accuracy is for the nerds.
Corals don't have built-in spectrometers so if you're close enough, it's good enough.

That's why the 400<=PAR<=700nm debate is silly. It's not like 399nm or 701nm are magically unusable. PAR is an approximation of photosynthetic response defined by a 1971 paper. All photons within the action spectrum have the potential to drive photosynthesis and can go beyond the PAR boundaries, depending on the pigments. There's no hard-and-fast cut-off in the natural world.

That said, knowing green is helpful as RFP fluorescence is stimulated by that band.
 
OP
OP
AKReefing

AKReefing

Active Member
View Badges
Joined
Nov 29, 2023
Messages
350
Reaction score
321
Location
Fairbanks
Rating - 0%
0   0   0
Yeah, all I need is to be able to do my own binning of LEDs between near-UVA and just above 500nm for growth, PPFD, pigmentation and fluorescence. The goal is to create a system in which the FWHM points are close or intersect for maximum fluorescence. Far too many sellers represent their LEDs as meeting a specific (peak) wavelength. I've found it to be hit and miss. I think the Spectryx is all I need to measure them all, at least above 400nm.
 

Assirem

New Member
View Badges
Joined
Feb 21, 2024
Messages
6
Reaction score
2
Location
Paris
Rating - 0%
0   0   0
Hello,
I am a spectroscopist amateur, I can say that this spectrometer is of very bad quality :( you can not even r resolve the pics @ 546nm. I estimate the resolution of that spectrometer at 10nmat at least. which is huge.
I thing for less money yo can get one like mine which has a sub-nanometer resolution. I am speaking about the leading company in affordable spectrometers, Thunder Optics.
look by yourself.
CCFL.jpg
 
OP
OP
AKReefing

AKReefing

Active Member
View Badges
Joined
Nov 29, 2023
Messages
350
Reaction score
321
Location
Fairbanks
Rating - 0%
0   0   0
That's a nice graph, but I don't plan to spend that kind of money for my simple needs. I'm not measuring spectra; I'm measuring single-color LEDs in the violet-blue range. Between ~400nm and 500nm, my spectrometer has performed extremely well with the box of 400 LEDs I've tested. You might want to buy one to play around with.

Anyway, I'm on to another task. I just bought a 2-year old 300 gallon peninsula tank that I need to update. I'll be building DIY LEDs for this. No effort will be wasted on green, yellow, orange or red light. I'll have a few whites on a separate circuit for use during tank maintenance.
 

Attachments

  • Peinsula before move.jpg
    Peinsula before move.jpg
    254 KB · Views: 12

Assirem

New Member
View Badges
Joined
Feb 21, 2024
Messages
6
Reaction score
2
Location
Paris
Rating - 0%
0   0   0
That's a nice graph, but I don't plan to spend that kind of money for my simple needs. I'm not measuring spectra; I'm measuring single-color LEDs in the violet-blue range. Between ~400nm and 500nm, my spectrometer has performed extremely well with the box of 400 LEDs I've tested. You might want to buy one to play around with.

Anyway, I'm on to another task. I just bought a 2-year old 300 gallon peninsula tank that I need to update. I'll be building DIY LEDs for this. No effort will be wasted on green, yellow, orange or red light. I'll have a few whites on a separate circuit for use during tank maintenance.
Waw!
Good acquisition :)
In fact what I wanted to say about the graph i sent, is that for the same price than a Spectryx, you can get a serious instrument for much better capabilities from Thunder Optics. This is for those who want to analyse the water pollution and color changing using their spectrometer.
I plan to start doing this with my Thunder Optics.
 

Assirem

New Member
View Badges
Joined
Feb 21, 2024
Messages
6
Reaction score
2
Location
Paris
Rating - 0%
0   0   0
Except I already bought the Spectryx, so buying another would double my cost for no benefit.
I think that you got me wrong :(
I was not suggesting you buy an other instrument, it is a nonsense in your case. I was giving my opinion on the topic for the users who may be interested in buying a spectrometer in the future.
Enjoy your instrument :)
Ciao
 

Andros_01

New Member
View Badges
Joined
Apr 10, 2024
Messages
1
Reaction score
0
Location
Italy
Rating - 0%
0   0   0
Mercury vapor-based UV sterilizers have deterministic UV-Vis spectral distribution with very narrow spectral peaks. Even if your meter doesn't read the UV-C range, it should show representation in the following bands:

(I)
Band 1365.0153
Band 2404.6563
Band 3435.8328
Band 4546.0735
Band 5576.9598

These were measured by NIST and can be used as a reference to compare measurements.

Unlike LEDs and other lights, UV lamps are governed purely by quantum theory and won't vary as much between bulbs. As the lamp is energized, the electrons in the mercury atoms get excited and begin to oscillate between lower and higher energy levels producing light in the UV-VIS spectrum with narrow bands corresponding to unique emission lines of mercury.
Owing to the simple electronic shell configuration of Mercury, Hg-Ne lamps are used in academia to calibrate instruments before they're used in experiments. Mercury-based UV sterilizers operate under the same principles so they can be used as an accessible substitute if certified traceability is not required.


In the 350-800nm band, you can expect to see a spectral signature that looks like the below:

UV Lamp Experimental Data.png


(I) Source:
K. Burns, K. B. Adams, and J. Longwell, J. Opt. Soc. Am. 40, 339 (1950). The lines of natural Hg I are broadened by hyperfine and isotopic structures. As a result, the line shapes can vary according to spectrometer resolution, observation time, etc. Mainly because such effects can affect the measured wavelengths, we have given no more than three decimal places for the lines of Hg I. Using a low-pressure electrodeless lamp source, Sansonetti et al. [SSR96] have made high-accuracy measurements of 26 of the Hg I wavelengths measured by Burns et al. in the 2536-5791 Å region; the resulting standard deviation of 0.003 Å between the two sets of measurements may be at least partly due to line-shape effects. We also note that the wavelengths given here should not be used for calibrations based on lines from pencil-type lamps if uncertainties smaller than 0.01 Å are desired; measurements by Sansonetti et al. [SSR96] in the region 2536-5791 Å show the pencil-lamp Hg wavelengths to be systematically longer than the values of Burns et al. by an average of 0.0068(32) Å.
Hi, i'd like to get into the topic that you are discussing; i'm doing a spectroscopy experiment with a prism and a mercury lamp, with a collimator and a telescope i'm seeing 5 bands of the color violet, light blue, blue, green and yellow. My point is that i can assing to this color the wavelenght that are shown in the figure above(band 2,3,4 and 5) but i can't assign a wavelenght to the light blue band, can you help me? If you need more details about the experimental appartus don't bother asking
 

oreo54

5000 Club Member
View Badges
Joined
Sep 18, 2017
Messages
5,617
Reaction score
3,456
Rating - 0%
0   0   0
Hi, i'd like to get into the topic that you are discussing; i'm doing a spectroscopy experiment with a prism and a mercury lamp, with a collimator and a telescope i'm seeing 5 bands of the color violet, light blue, blue, green and yellow. My point is that i can assing to this color the wavelenght that are shown in the figure above(band 2,3,4 and 5) but i can't assign a wavelenght to the light blue band, can you help me? If you need more details about the experimental appartus don't bother asking
You missing the cyan one? Minor peak around 490?
Hg_vs_LED_SPD.png

spectrogram.jpg
 

Keeping it clean: Have you used a filter roller?

  • I currently use a filter roller.

    Votes: 44 29.3%
  • I don’t currently use a filter roller, but I have in the past.

    Votes: 5 3.3%
  • I have never used a filter roller, but I plan to in the future.

    Votes: 41 27.3%
  • I have never used a filter roller and have no plans to in the future.

    Votes: 52 34.7%
  • Other.

    Votes: 8 5.3%
Back
Top