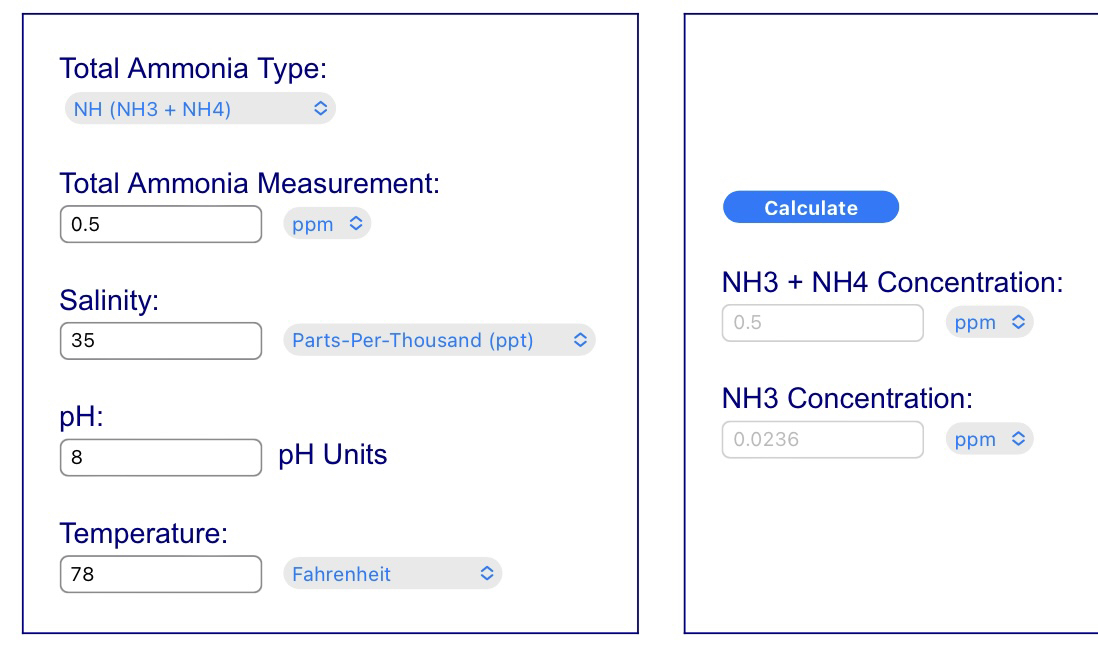
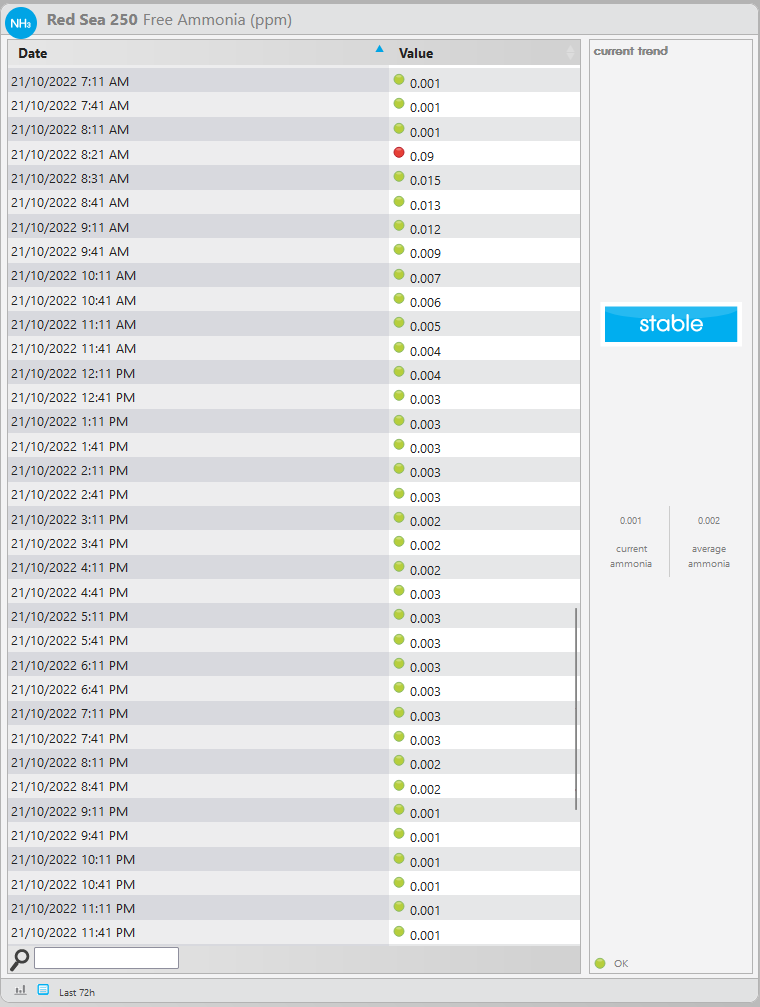
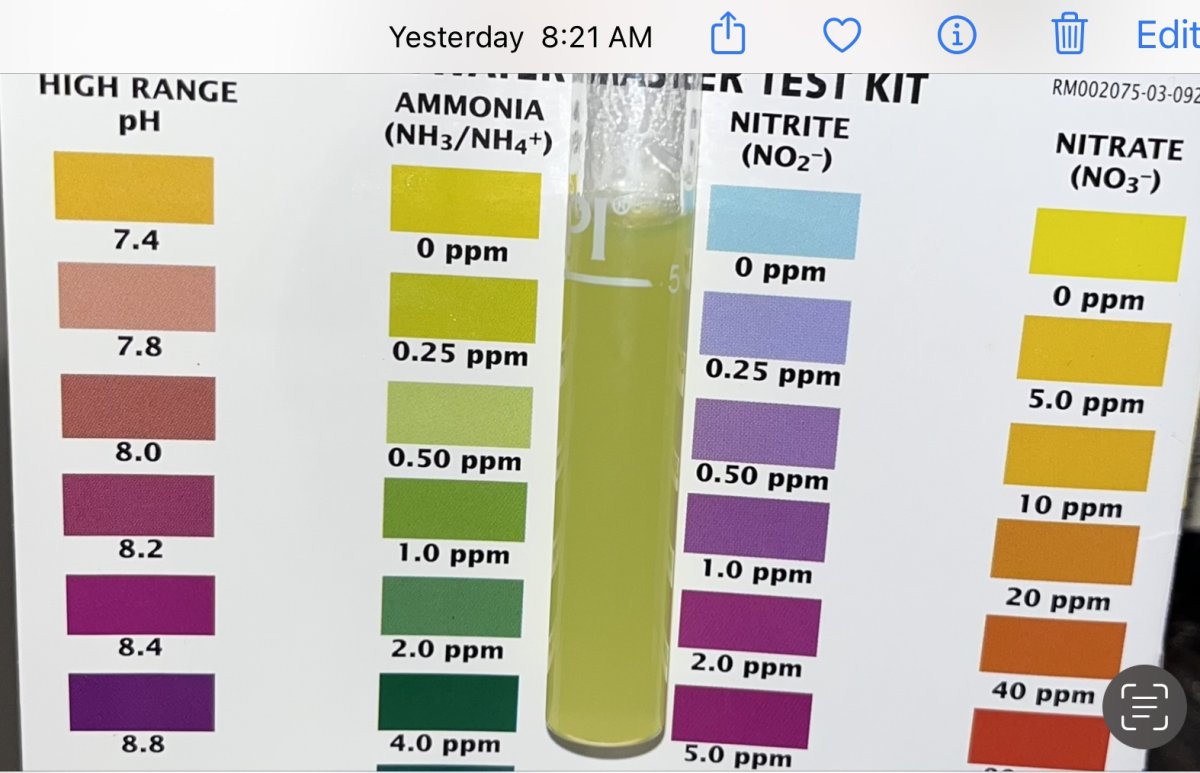
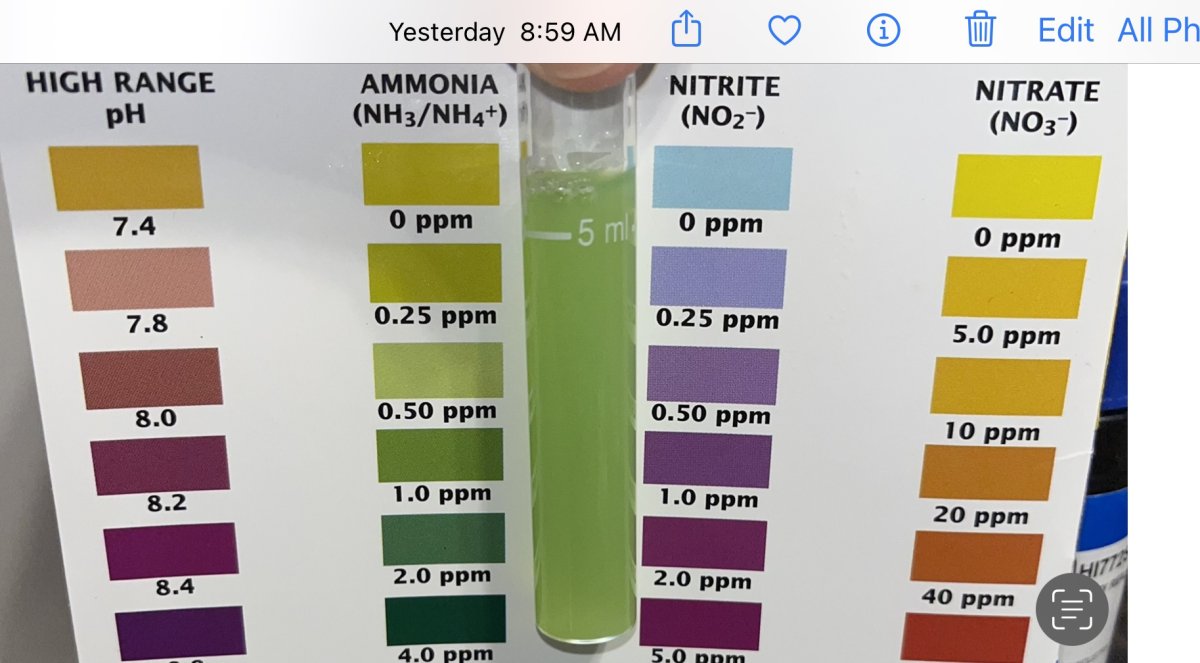
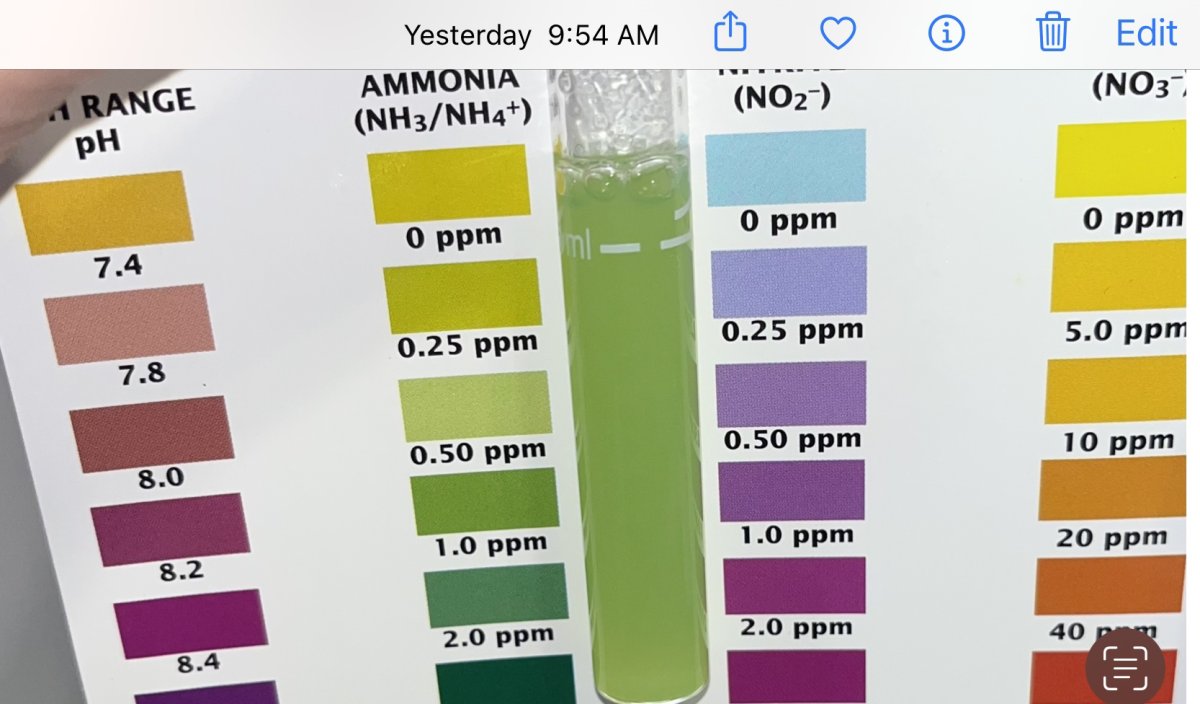
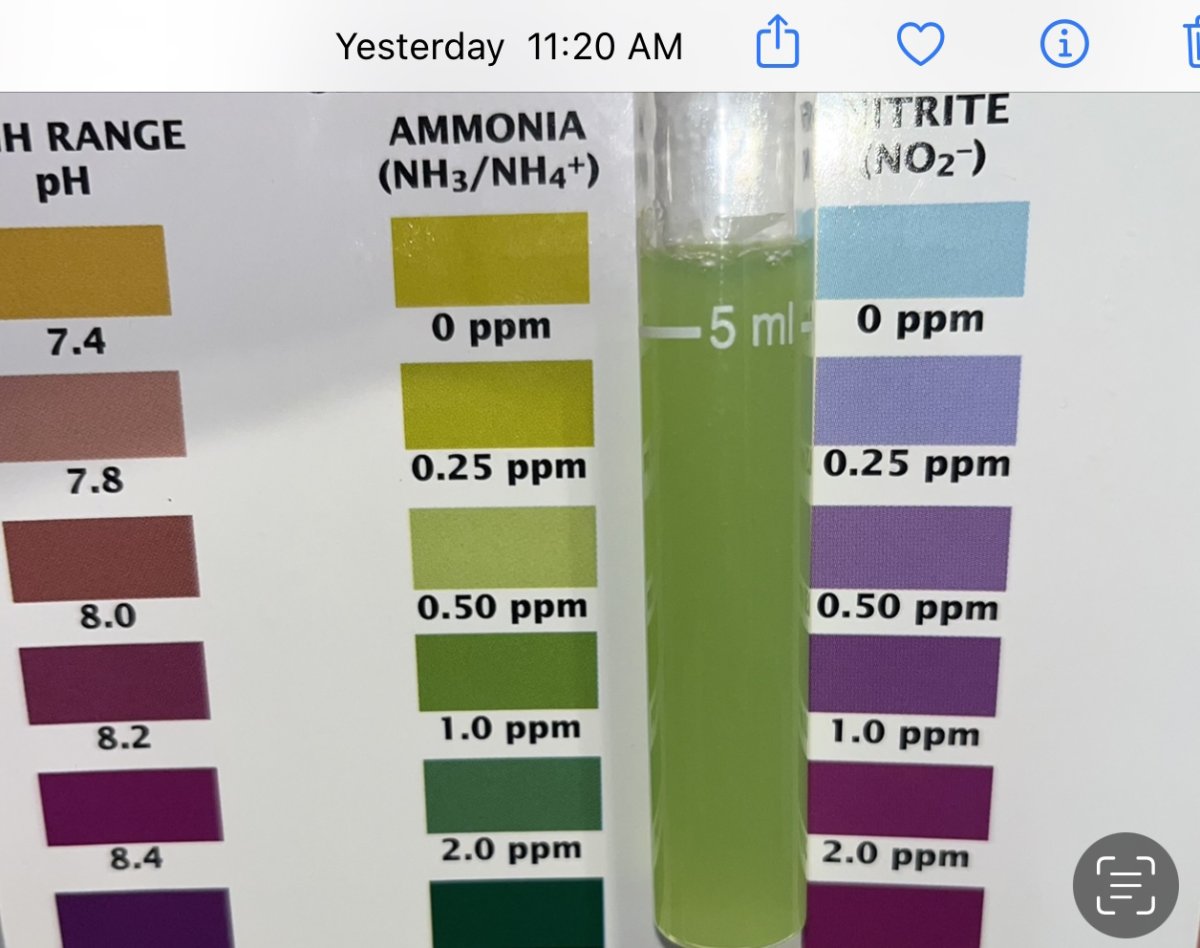
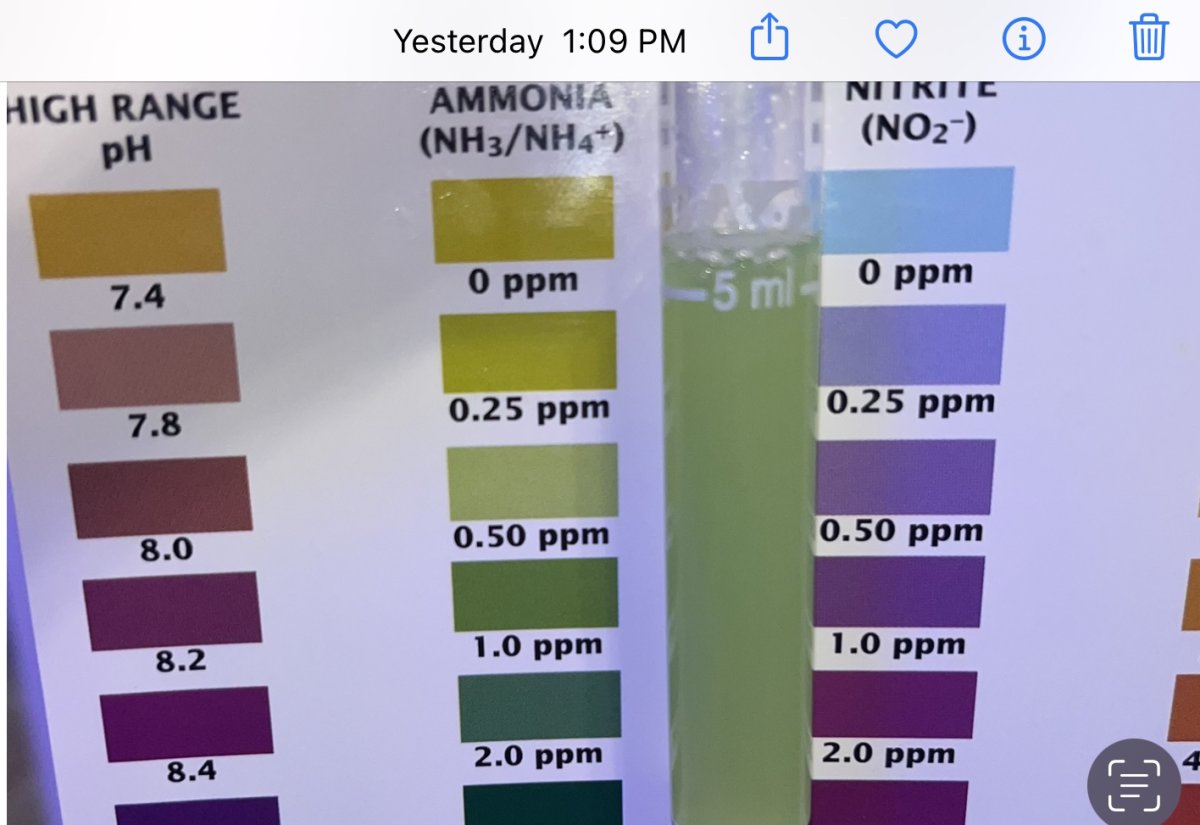
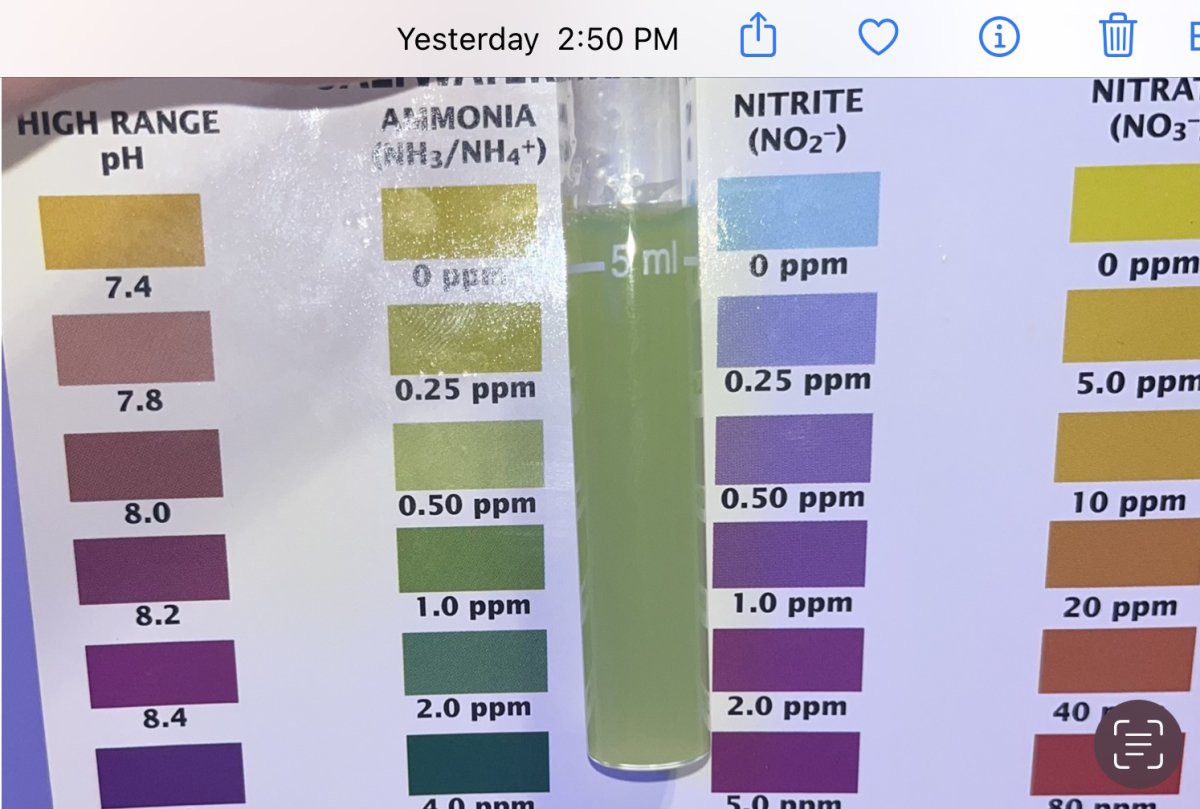
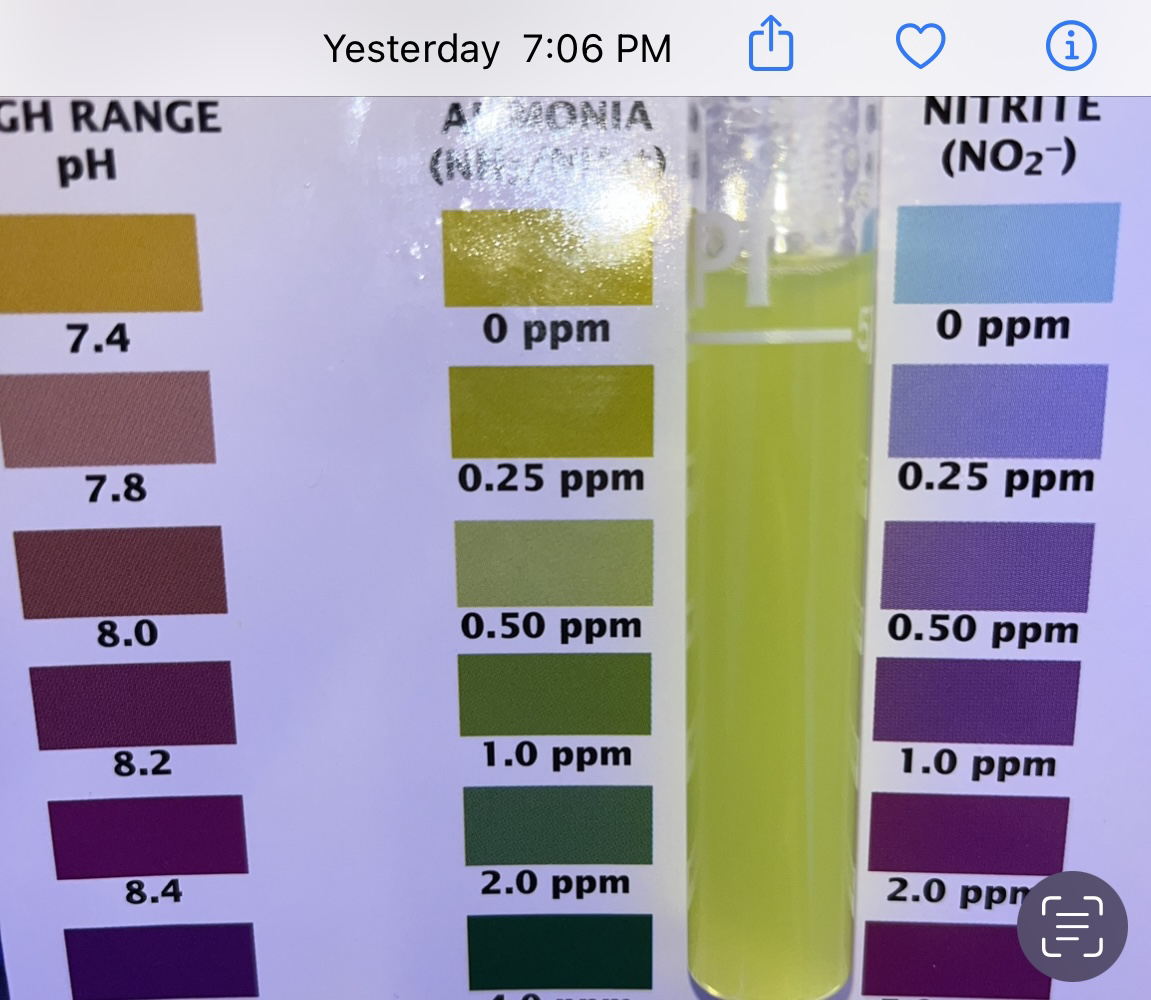
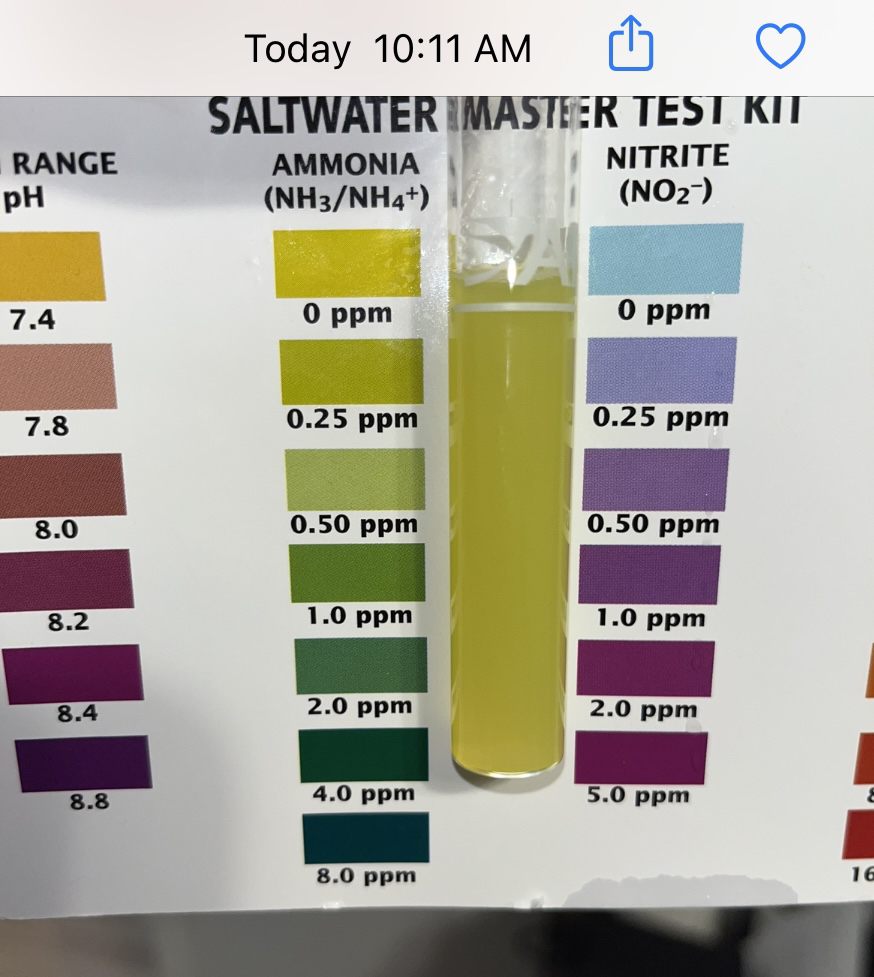
Ok, at 0.5ppm NH3/NH4 at pH 8.4 (if it was that far off) could be a problem as the free ammonia would read 0.05 ish on the seneye, if it’s working correctly. According to those in the know, that’s when gill damage can occur.
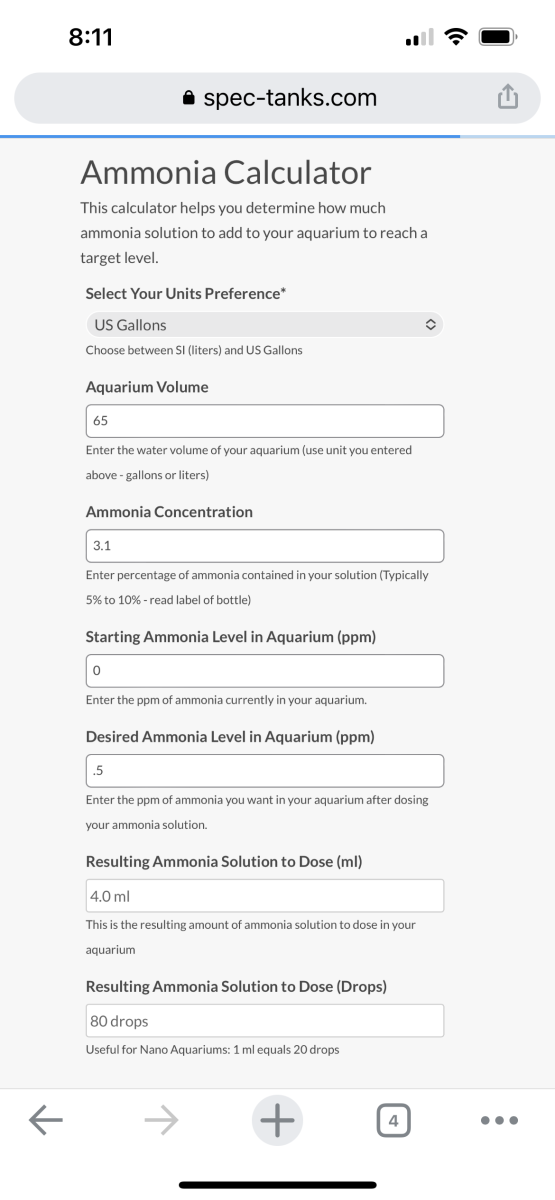
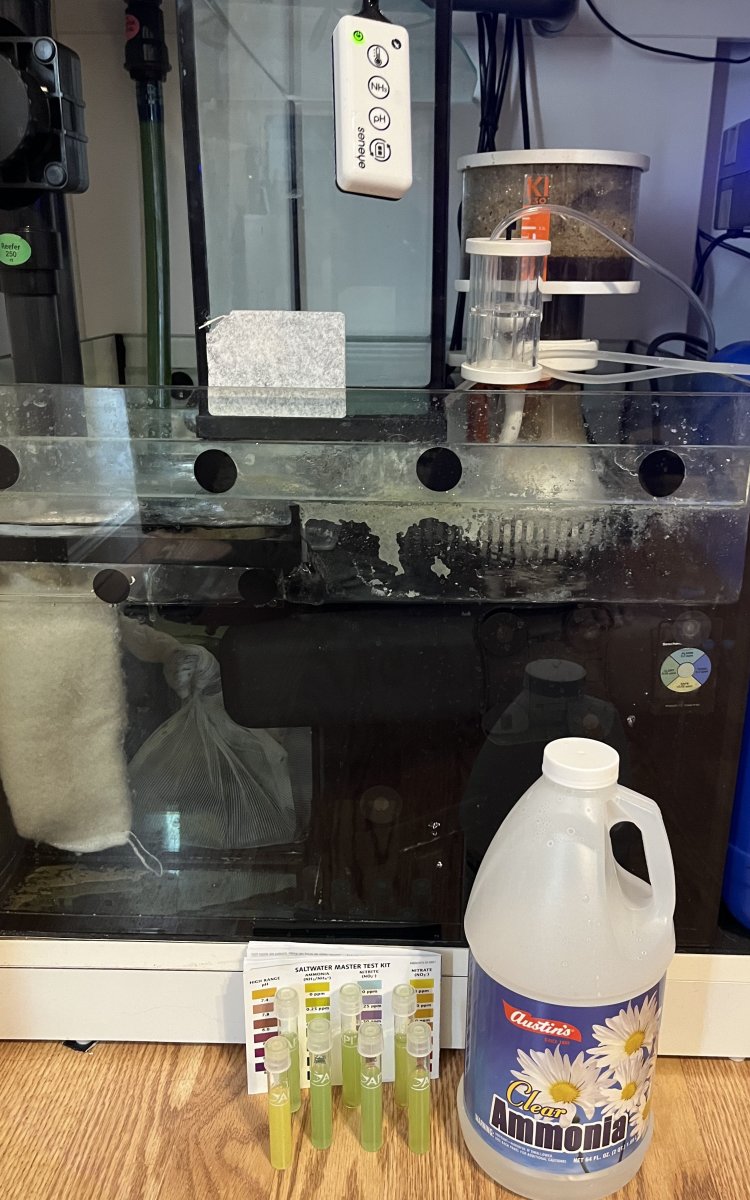
Dissecting your results the Seneye appears accurate in ammonia readings if the pH is actually 7.9, which agrees with your observations (assuming you’ve added the right amount of ammonia for the water volume etc, etc).
Would like to see the plot on a graph for the ammonia reduction. Appears folks think it should be a straight line to zero ish (can’t remember where I’ve read that). Visualizing your data in pictorial form it’s more like a reduction in efficiency at the lower end and it flattens out. Not important by any means, I’m just curious.