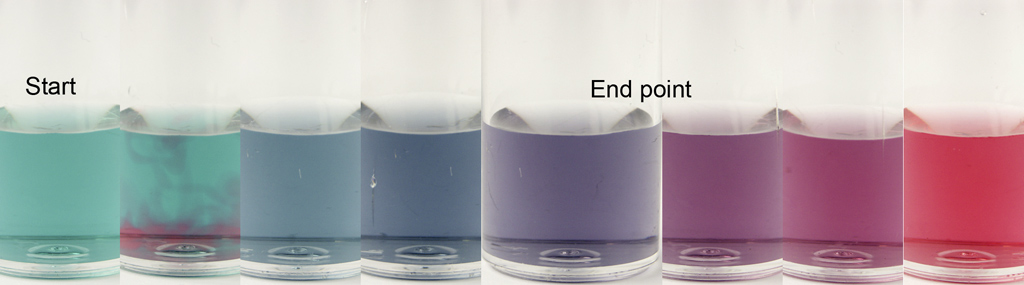


TL;DR: The endpoint pH is 4.41, and the endpoint color is that "lavender" color I've been telling people about.
Over the years, there have been many threads on R2R and other forums debating a couple of basic details relevant to testing for alkalinity in reef aquaria. One of the most fundamental questions is about the correct endpoint pH value for an alkalinity titration in seawater. The values commonly tossed around seem to range from a pH of 4.2 to 4.6, with 4.5 being commonly cited. Another more basic and specific question that is quite common is about the correct color of the endpoint of the Salifert alkalinity test that should be used for the most accurate results. This thread attempts to address both of those questions, since they both are pertinent to alkalinity test accuracy.
DISCLAIMER: I stipulate that great accuracy in alkalinity measurements are, within reason, not really important, and that "stability" (read: precision) is vastly more important. Please do not respond to this point; it is already well taken. An implicit assumption in this post is that it is for the benefit of those who choose to strive not only for that all-important precision ("stability"), but also for accuracy as well. The whole point of this post is to address accuracy in alkalinity measurements, both more broadly, but also with regards to the Salifert test kit. Again, I know accuracy isn't really that important relative to stability, so please don't clutter this thread up with posts about that. Please refrain from offering your sage advice about not "chasing numbers".
There have been several threads previously started on R2R surrounding these two question. Below is a short list of some of them. I will be posting links to this thread in each of these, in order to draw people's attention to this attempt to answer these questions.
DIY Alk test discussion thread
Salifert Kh testing question
Salifert KH/Alk testing help
Salifert Test Kit and Hanna Checker Results for Alkalinity
Color Change in Salifert Test Kits...how do I know when it's done?
To recap, the two questions I intend to address are these:
1) What is the correct pH of the endpoint of an alkalinity titration in seawater?
2) What is the color that corresponds to this endpoint when using the Salifert test kit?
My approach towards trying to answer these questions was to do this titration in my basement lab, using a magnetic stirrer, a Class A 50 mL burette, a decent quality pH probe, and a white-balanced camera taking images under natural sunlight. During the course of the titration (and extending beyond the endpoint), I recorded the volume of reagent used, the pH of the solution, and took a picture of the color of the solution (when relevant, i.e., near the endpoint), at numerous points.
The resulting reagent volume and pH data was fed to the Alkalinity Calculator provided by the USGS that can be found here: https://or.water.usgs.gov/alk/ . This calculator is specifically designed to take this exact sort of data, and to calculate the endpoint pH, total alkalinity, and many other parameters from the raw data using a number of different methods. These methods include inflection point determination, two different theoretical linear regression models, and two different Gran plot determinations. It is a mathematically rigorous approach that looks at the same data a number of different ways. It factors in things such as the salinity and temperature of the sample, and also the concentration of the acid reagent (in order to compensate for the dilution of the sample by the reagent during the course of the titration).
I used the indicator dye that is included with the Salifert kit. In order to be able to meaningfully do the titration using a 50 mL burette, I have to scale up the volume of the test from the Salifert instructions. Rather than using only 4 mL of sample, I'm using 200 mL of sample, in order to get the volume of reagent necessary to complete the test to be a significant fraction of the 50 mL volume of the burette I am using. Think of it as though I'm using a 50 mL syringe, instead of a 1 mL syringe, so I'm using 50 times the amount of sample. Scaling the test up like this enables me to take more precise volume measurements. I used an HCl-based acid reagent that is the same concentration (normality) as the reagent in the Salifert test kit (inferred from the Salifert test kit instructions), so that the dilution factor that happens during the course of the titration remained proportionally the same as when doing the Salifert test according to the kit's instructions.
Since the "vial" I am using is a 250 mL conical flask instead of the small vial supplied with the Salifert kit, the diameter through which I am looking is much larger, so the amount of indicator dye necessary is proportionally less. That means that I used proportionally less dye than that used when doing the Salifert test according to the instructions. If I had used a proportional amount of dye, the resulting solution would be way too dark/intense in color. I used an amount of dye that is appropriate in order to get good pictures of the color, which ended up being about 40 drops. The exact amount of dye used is not really relevant to the test; you only need to be able to see the color well.
The pH probe I'm using is a Hanna HALO Wireless Field pH Meter model HI12302. It supports a five-point calibration, has a resolution of 0.001 pH units, and is capable of doing continuous data logging (once per second). The data can be downloaded as a CSV file for post-processing. It also has the ability to flag certain data points, and to only download the "flagged" data points. I calibrated it immediately before doing the titration, and then verified the calibration against fresh 4.00 and 4.65 buffers immediately before beginning the titration. It was within 0.005 pH units of both of those buffers. During the titration, I waited until the pH probe had stabilized to the point that it reported the exact same value to 0.001 pH units for at least 10 seconds before "flagging" a reading each time.
The saltwater used for this test was some 24 hours old Brightwell Aquatics NeoMarine salt mix. I chose it because the alkalinity value it targets is near NSW levels. I also had a bunch of plain old Instant Ocean available, but it tends to have significantly higher alkalinity than NSW. Since most of the literature around alkalinity determination in seawater is geared towards actual NSW, and since elevated alkalinity affects the pH of the titration endpoint, I chose to go with the salt mix I had on hand that most closely matches NSW with regards to alkalinity. The saltwater used for this test had an average total alkalinity value of 6.84 across multiple tests on two different newly calibrated Neptune Trident prototypes. NSW has an alkalinity of 6.64 dKH (Pilson, An Introduction to the Chemistry of the Sea, Second Edition, Page 67).
As stated above, I also used a camera to record the color of the solution during the critical part of the titration. This "critical part" is in a pH range from around 5.0 to 4.0 The light source was natural daylight from a south-facing window, diffused through neutral white blinds, during a cloudy day. The room lights were off. The camera is a Canon 5D Mk II, with white balance referenced to the blinds. This enables me to construct a color chart of dye color vs. solution pH for the Salifert test.
What I did in this test is the following:
1) Measure 200 mL of the saltwater sample, and deliver it into a clean, dry 250 mL conical flask already containing an appropriately-sized Teflon-coated magnetic stir bar.
2) Add 40 drops of the Salifert alkalinity test kit dye to get a good intensity of color that will be easy to photograph, while planning for dilution by the acid reagent.
3) Fill the 50 mL burette with the 0.02234 N (Salifert concentration based on their instructions) HCL reagent (after best-practice "conditioning" it) to just below the 0.00 mark.
4) Record the initial burette volume using best practices vis-à-vis reading the meniscus, and subtract this value from all subsequent readings taken in #7 below.
5) Place the flask on the magnetic stirrer, under the burette, with the pH probe inserted, all arranged so that the pH probe doesn't interfere with either the drops from the burette or the stir bar.
6) Set the speed on the magnetic stirrer to ensure good, vigorous stirring.
7) Record the burette volume using best practices.
8) Make sure the pH probe reading remains stable at the same value with a 0.001 pH unit resolution for at least 10 seconds, then "flag" the reading.
9) If we are within the "critical range" for the color change, then also take a picture of the flask.
10) Add appx. 20 - 30 drops / 1.0 - 1.5 mL of reagent.
11) Repeat #7 through #10 above until the pH is down to 3.5. Between pH 5.0 and 4.0, reduce the volume delivered in each step #10 down to just 4 drops / 0.2 mL for better resolution.
Now, for the purposes of answering the two questions listed in the "recap" above, it really doesn't matter exactly what the concentration of the sample is (as long as it is somewhat representative to NSW), or exactly what the concentration of the reagent is. In other words, it doesn't really matter what the "right" answer is; the accuracy of this particular titration is not really relevant, so long as we are doing a truly representative titration. The endpoint pH and dye color at that pH are what we are after; the actual result is irrelevant to the answer to these questions. I know it is odd to not care about the accuracy of your result when doing a test like this, when the stated purpose is to address accuracy, but the point of this thread is to provide visibility into the method itself, rather than to focus on the results of the method applied to this particular titration of this particular sample with this particular acid reagent. In other words, I did not bother to "standardize", or verify, the concentration of the acid reagent used, and that doesn't matter, as long as it is in the "ballpark" of what I expect it to be. Again, the pH of the endpoint and the color of the dye at that pH are the data points we are really after.
This is the raw data from the titration:

This is a graph of the titration curve, and the first derivative of that curve:

The results from the Oregon Water Science Center / USGS Alkalinity Calculator website provided these pH values for the endpoint, using the various different methods: Inflection point = pH 4.41, Theoretical #1 = pH 4.42, and Theoretical #2 = pH 4.54. It should be noted that Theoretical method #2 gives poor results when there are sources of alkalinity in the sample other than just carbonate and bicarbonate. Since our sample does contain some borate, this might account for this discrepancy.
Hopefully, this will shed some light on the answer to question #1 above.
Of the pictures I took during the titration, the one taken at pH 4.466 is the closest to the actual endpoint, and this is what the flask looked like at that time:

I do concede that this color is a little bit more towards the "pink" end of the scale than the "lavender" I have prevously been trying to describe. The color I've had in mind is more like the one you see for pH 4.55 in the chart below.
I sampled the RGB values of various points across all the pictures I took from around pH 5.15 to around pH 3.85, equalized the overall luminance across them, and then constructed third-order polynomial curves to model the RGB values across this pH range. Not surprisingly, the curves fit the data very nicely. Based on those curves, I then built the following color chart:

Within the last week, I have performed similar titrations of different saltwater samples ranging in alkalinity up to 10 dKH. Some of the samples were Trident calibration standards I had made up that contained no borate at all. In all cases, the resulting endpoint pH values were consistently between 4.4 and 4.5.
Based on this work, I submit that the correct pH endpoint for this titration lies between 4.4 and 4.5. I also submit that the correct color of the Salifert test kit is, in fact, that "lavender" color I've promoted. If you take the titration all the way to "pink" without any blue left, as many people do, I find that you are stopping at an endpoint closer to 4.0 or even lower, which will cause your result to be somewhere from 5% to 10% too high.
Over the years, there have been many threads on R2R and other forums debating a couple of basic details relevant to testing for alkalinity in reef aquaria. One of the most fundamental questions is about the correct endpoint pH value for an alkalinity titration in seawater. The values commonly tossed around seem to range from a pH of 4.2 to 4.6, with 4.5 being commonly cited. Another more basic and specific question that is quite common is about the correct color of the endpoint of the Salifert alkalinity test that should be used for the most accurate results. This thread attempts to address both of those questions, since they both are pertinent to alkalinity test accuracy.
DISCLAIMER: I stipulate that great accuracy in alkalinity measurements are, within reason, not really important, and that "stability" (read: precision) is vastly more important. Please do not respond to this point; it is already well taken. An implicit assumption in this post is that it is for the benefit of those who choose to strive not only for that all-important precision ("stability"), but also for accuracy as well. The whole point of this post is to address accuracy in alkalinity measurements, both more broadly, but also with regards to the Salifert test kit. Again, I know accuracy isn't really that important relative to stability, so please don't clutter this thread up with posts about that. Please refrain from offering your sage advice about not "chasing numbers".
There have been several threads previously started on R2R surrounding these two question. Below is a short list of some of them. I will be posting links to this thread in each of these, in order to draw people's attention to this attempt to answer these questions.
DIY Alk test discussion thread
Salifert Kh testing question
Salifert KH/Alk testing help
Salifert Test Kit and Hanna Checker Results for Alkalinity
Color Change in Salifert Test Kits...how do I know when it's done?
To recap, the two questions I intend to address are these:
1) What is the correct pH of the endpoint of an alkalinity titration in seawater?
2) What is the color that corresponds to this endpoint when using the Salifert test kit?
My approach towards trying to answer these questions was to do this titration in my basement lab, using a magnetic stirrer, a Class A 50 mL burette, a decent quality pH probe, and a white-balanced camera taking images under natural sunlight. During the course of the titration (and extending beyond the endpoint), I recorded the volume of reagent used, the pH of the solution, and took a picture of the color of the solution (when relevant, i.e., near the endpoint), at numerous points.
The resulting reagent volume and pH data was fed to the Alkalinity Calculator provided by the USGS that can be found here: https://or.water.usgs.gov/alk/ . This calculator is specifically designed to take this exact sort of data, and to calculate the endpoint pH, total alkalinity, and many other parameters from the raw data using a number of different methods. These methods include inflection point determination, two different theoretical linear regression models, and two different Gran plot determinations. It is a mathematically rigorous approach that looks at the same data a number of different ways. It factors in things such as the salinity and temperature of the sample, and also the concentration of the acid reagent (in order to compensate for the dilution of the sample by the reagent during the course of the titration).
I used the indicator dye that is included with the Salifert kit. In order to be able to meaningfully do the titration using a 50 mL burette, I have to scale up the volume of the test from the Salifert instructions. Rather than using only 4 mL of sample, I'm using 200 mL of sample, in order to get the volume of reagent necessary to complete the test to be a significant fraction of the 50 mL volume of the burette I am using. Think of it as though I'm using a 50 mL syringe, instead of a 1 mL syringe, so I'm using 50 times the amount of sample. Scaling the test up like this enables me to take more precise volume measurements. I used an HCl-based acid reagent that is the same concentration (normality) as the reagent in the Salifert test kit (inferred from the Salifert test kit instructions), so that the dilution factor that happens during the course of the titration remained proportionally the same as when doing the Salifert test according to the kit's instructions.
Since the "vial" I am using is a 250 mL conical flask instead of the small vial supplied with the Salifert kit, the diameter through which I am looking is much larger, so the amount of indicator dye necessary is proportionally less. That means that I used proportionally less dye than that used when doing the Salifert test according to the instructions. If I had used a proportional amount of dye, the resulting solution would be way too dark/intense in color. I used an amount of dye that is appropriate in order to get good pictures of the color, which ended up being about 40 drops. The exact amount of dye used is not really relevant to the test; you only need to be able to see the color well.
The pH probe I'm using is a Hanna HALO Wireless Field pH Meter model HI12302. It supports a five-point calibration, has a resolution of 0.001 pH units, and is capable of doing continuous data logging (once per second). The data can be downloaded as a CSV file for post-processing. It also has the ability to flag certain data points, and to only download the "flagged" data points. I calibrated it immediately before doing the titration, and then verified the calibration against fresh 4.00 and 4.65 buffers immediately before beginning the titration. It was within 0.005 pH units of both of those buffers. During the titration, I waited until the pH probe had stabilized to the point that it reported the exact same value to 0.001 pH units for at least 10 seconds before "flagging" a reading each time.
The saltwater used for this test was some 24 hours old Brightwell Aquatics NeoMarine salt mix. I chose it because the alkalinity value it targets is near NSW levels. I also had a bunch of plain old Instant Ocean available, but it tends to have significantly higher alkalinity than NSW. Since most of the literature around alkalinity determination in seawater is geared towards actual NSW, and since elevated alkalinity affects the pH of the titration endpoint, I chose to go with the salt mix I had on hand that most closely matches NSW with regards to alkalinity. The saltwater used for this test had an average total alkalinity value of 6.84 across multiple tests on two different newly calibrated Neptune Trident prototypes. NSW has an alkalinity of 6.64 dKH (Pilson, An Introduction to the Chemistry of the Sea, Second Edition, Page 67).
As stated above, I also used a camera to record the color of the solution during the critical part of the titration. This "critical part" is in a pH range from around 5.0 to 4.0 The light source was natural daylight from a south-facing window, diffused through neutral white blinds, during a cloudy day. The room lights were off. The camera is a Canon 5D Mk II, with white balance referenced to the blinds. This enables me to construct a color chart of dye color vs. solution pH for the Salifert test.
What I did in this test is the following:
1) Measure 200 mL of the saltwater sample, and deliver it into a clean, dry 250 mL conical flask already containing an appropriately-sized Teflon-coated magnetic stir bar.
2) Add 40 drops of the Salifert alkalinity test kit dye to get a good intensity of color that will be easy to photograph, while planning for dilution by the acid reagent.
3) Fill the 50 mL burette with the 0.02234 N (Salifert concentration based on their instructions) HCL reagent (after best-practice "conditioning" it) to just below the 0.00 mark.
4) Record the initial burette volume using best practices vis-à-vis reading the meniscus, and subtract this value from all subsequent readings taken in #7 below.
5) Place the flask on the magnetic stirrer, under the burette, with the pH probe inserted, all arranged so that the pH probe doesn't interfere with either the drops from the burette or the stir bar.
6) Set the speed on the magnetic stirrer to ensure good, vigorous stirring.
7) Record the burette volume using best practices.
8) Make sure the pH probe reading remains stable at the same value with a 0.001 pH unit resolution for at least 10 seconds, then "flag" the reading.
9) If we are within the "critical range" for the color change, then also take a picture of the flask.
10) Add appx. 20 - 30 drops / 1.0 - 1.5 mL of reagent.
11) Repeat #7 through #10 above until the pH is down to 3.5. Between pH 5.0 and 4.0, reduce the volume delivered in each step #10 down to just 4 drops / 0.2 mL for better resolution.
Now, for the purposes of answering the two questions listed in the "recap" above, it really doesn't matter exactly what the concentration of the sample is (as long as it is somewhat representative to NSW), or exactly what the concentration of the reagent is. In other words, it doesn't really matter what the "right" answer is; the accuracy of this particular titration is not really relevant, so long as we are doing a truly representative titration. The endpoint pH and dye color at that pH are what we are after; the actual result is irrelevant to the answer to these questions. I know it is odd to not care about the accuracy of your result when doing a test like this, when the stated purpose is to address accuracy, but the point of this thread is to provide visibility into the method itself, rather than to focus on the results of the method applied to this particular titration of this particular sample with this particular acid reagent. In other words, I did not bother to "standardize", or verify, the concentration of the acid reagent used, and that doesn't matter, as long as it is in the "ballpark" of what I expect it to be. Again, the pH of the endpoint and the color of the dye at that pH are the data points we are really after.
This is the raw data from the titration:
This is a graph of the titration curve, and the first derivative of that curve:
The results from the Oregon Water Science Center / USGS Alkalinity Calculator website provided these pH values for the endpoint, using the various different methods: Inflection point = pH 4.41, Theoretical #1 = pH 4.42, and Theoretical #2 = pH 4.54. It should be noted that Theoretical method #2 gives poor results when there are sources of alkalinity in the sample other than just carbonate and bicarbonate. Since our sample does contain some borate, this might account for this discrepancy.
Hopefully, this will shed some light on the answer to question #1 above.
Of the pictures I took during the titration, the one taken at pH 4.466 is the closest to the actual endpoint, and this is what the flask looked like at that time:
I do concede that this color is a little bit more towards the "pink" end of the scale than the "lavender" I have prevously been trying to describe. The color I've had in mind is more like the one you see for pH 4.55 in the chart below.
I sampled the RGB values of various points across all the pictures I took from around pH 5.15 to around pH 3.85, equalized the overall luminance across them, and then constructed third-order polynomial curves to model the RGB values across this pH range. Not surprisingly, the curves fit the data very nicely. Based on those curves, I then built the following color chart:
Within the last week, I have performed similar titrations of different saltwater samples ranging in alkalinity up to 10 dKH. Some of the samples were Trident calibration standards I had made up that contained no borate at all. In all cases, the resulting endpoint pH values were consistently between 4.4 and 4.5.
Based on this work, I submit that the correct pH endpoint for this titration lies between 4.4 and 4.5. I also submit that the correct color of the Salifert test kit is, in fact, that "lavender" color I've promoted. If you take the titration all the way to "pink" without any blue left, as many people do, I find that you are stopping at an endpoint closer to 4.0 or even lower, which will cause your result to be somewhere from 5% to 10% too high.
Last edited: