- Joined
- May 22, 2016
- Messages
- 6,545
- Reaction score
- 10,102
Hanna's saltwater ammonia checker, Hi784 is out and I wanted to take a look and assess its performance for reef tank water, and see where some interpretation of results might be helpful. This post will include some data on a display tank processing ammonia, and in a later post I'll do a comparison of accuracy vs ammonia stock additions.
Checker specs
This (like the other chemical tests - API, red sea etc.) is a total ammonia test using salicylate method.
The other common ammonia detection method in the hobby is the Seachem ammonia alert badges, multi-test disks and seneye, which all use gas-permeable membranes to measure NH3 only. Calculation of toxic free ammonia, NH3 from the hanna total ammonia test involves using a table of pH and temp like what's included in the hanna checker manual
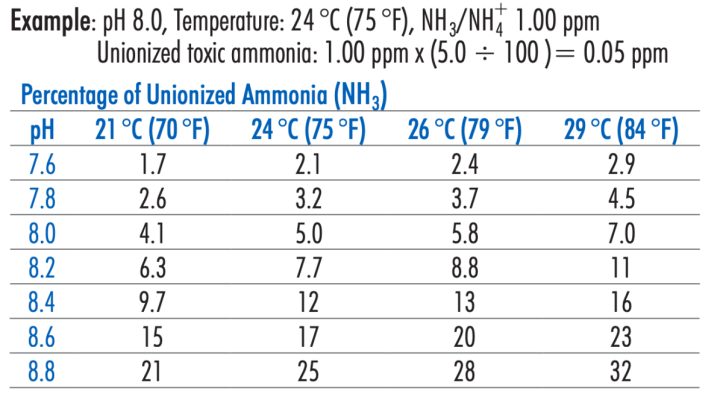
These are the %'s to multiply the total ammonia reading by to calculate toxic free ammonia, NH3.
Using the kit, you'll find it's very much like the API test. The first liquid drop reagent contains the salicylate and nitroprusside compounds that makes up the thick yellow/brown drops, and the last liquid drop reagent is the high pH additive, sodium hydroxide and the hypochlorite, again like API. The "new" bit that makes it work for a hanna checker is the powder reagent B added between the two liquids, it's a chelating agent to prevent cloudiness that would cause the checker color measurement step to fail.
( @Dan_P posted how to do this using sodium citrate to keep the API test clear and run it in a hanna checker at 610nm a year and a half ago.)
The cloudiness-killing step is essential, and if cloudiness forms in your sample by the end of the 15 minute hold time - from not enough reagent B, or salinity too high - then don't bother with the checker step, cloudiness will read nonsense high.
The first performance question to talk about is results on perfectly stable tanks. Measurements of mature stable systems seem to generate values in the 0.1-0.2 ppm range. Here's @SaltwaterAq measuring 0.19ppm total ammonia on a healthy mature system, and my display that consistently runs zeros on NO3 (and all other inorganic N forms) measured 0.15, and 0.14 (not near feeding times) on two different days.
Since a stable mature system is almost everybody, some clarity here is helpful as to whether our tanks are actually generating a couple of tenths of total ammonia by constant churn of remineralization of food, or if this is simply a test kit artifact.
A simple way to illuminate this is how a mature system handles a known several tenths ppm of ammonia and compare to what the hanna checker is seeing. So I added an expected ~+0.50ppm total ammonia to my display (carefully measured, I already know how my system consumes ammonia, and it was at pH at 7.8, so no real hazard here)
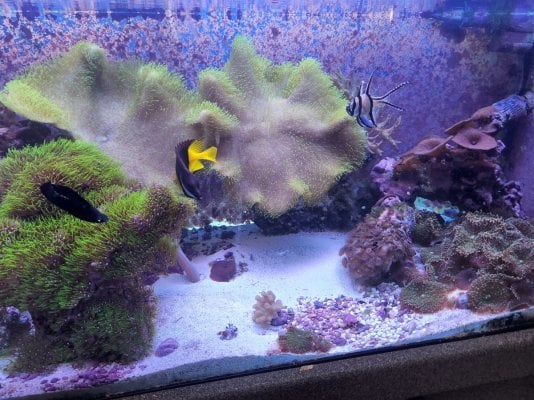
(lots of ammonia-consuming surfaces between the display and the lighted sump)
Blue stars show the baseline measurement, and red shows the values while the spiked ammonia is being consumed.
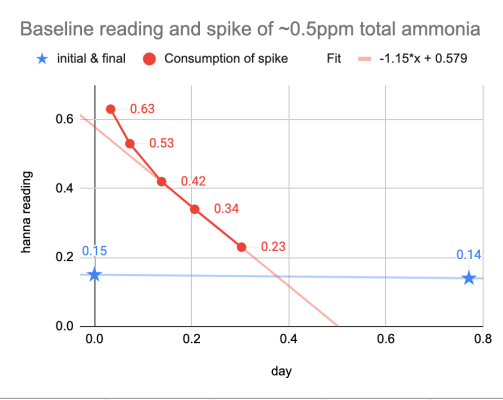
Here you can see a few features.
1) the expected spike of +0.5ppm ammonia is well measured (actual calibration curve in a later post when I get more reagents).
2) the depletion trend is consistent, and the checker captured very well the mechanics of what's going on.
3) the consumption rate is consistent with the idea that actual ammonia is consumed rapidly in a tank like this: in fact the consumption rate is pretty steady at 0.5, 0.4, 0.3 down to 0.2 ppm ammonia. It makes very little sense to suggest consumption suddenly stops at 0.15ppm.
Instead it is far more likely that the detected 0.1-0.2ppm ammonia that people are measuring is simply a test kit artifact, and very unlikely that tanks deplete ammonia rapidly from 0.5ppm to 0.2ppm then just stop.
This phantom couple of tenths total ammonia will be very familiar to anyone who's seen a bunch of API tests.
Below is what the reacted tests on clear tank water looks like for test results measuring 0.15 ppm.
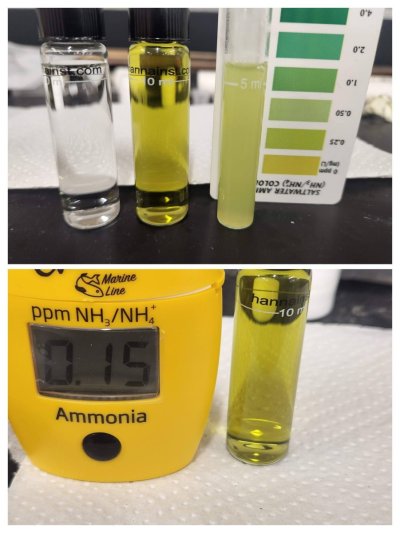
Notice that both API and hanna generate this blush of "not-quite-yellow" color that people (and now the checker's digital eyeball) misinterpret as an ammonia detection. This is simply an artifact of the test kit chemistry. Compare to what a genuine detection of ~0.5 ppm ammonia looks like below. There is no confusion or ambiguity.
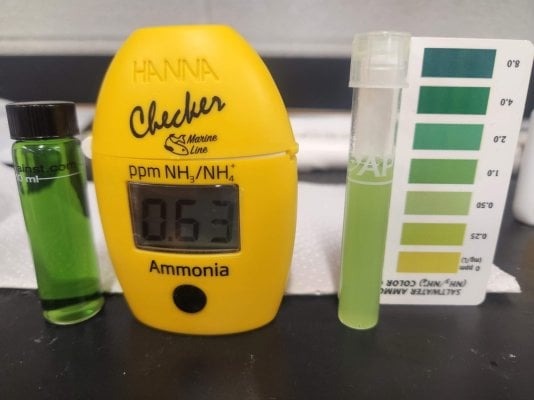
There are some chemistry details on the formation of this low level test kit artifact (it's not just people's bad eyes getting fooled), but I'll save it for later.
The short answer is to simply interpret 0.1-0.2ppm readings as zero baseline the same way a slight blush of green on API should be read as zero.
Calibration data for the Hanna Kit is here in post #10
Checker specs
| Range | 0.00 to 2.50 ppm (mg/L) NH3 [to clarify, it's actually NH3+NH4] |
| Resolution | 0.01ppm |
| Accuracy @ 25°C/77°F | ±0.05 ppm ±5% of reading @ 25 °C (77 °F) |
| Light Source | Light Emitting Diode @ 610 nm |
| Light Detector | Silicon photocell |
| Method | Adaptation of the Salicylate Method. The reaction between Ammonia and Ammonium and the reagent causes a blue‑green tint in the sample. |
This (like the other chemical tests - API, red sea etc.) is a total ammonia test using salicylate method.
The other common ammonia detection method in the hobby is the Seachem ammonia alert badges, multi-test disks and seneye, which all use gas-permeable membranes to measure NH3 only. Calculation of toxic free ammonia, NH3 from the hanna total ammonia test involves using a table of pH and temp like what's included in the hanna checker manual

These are the %'s to multiply the total ammonia reading by to calculate toxic free ammonia, NH3.
Using the kit, you'll find it's very much like the API test. The first liquid drop reagent contains the salicylate and nitroprusside compounds that makes up the thick yellow/brown drops, and the last liquid drop reagent is the high pH additive, sodium hydroxide and the hypochlorite, again like API. The "new" bit that makes it work for a hanna checker is the powder reagent B added between the two liquids, it's a chelating agent to prevent cloudiness that would cause the checker color measurement step to fail.
( @Dan_P posted how to do this using sodium citrate to keep the API test clear and run it in a hanna checker at 610nm a year and a half ago.)
The cloudiness-killing step is essential, and if cloudiness forms in your sample by the end of the 15 minute hold time - from not enough reagent B, or salinity too high - then don't bother with the checker step, cloudiness will read nonsense high.
The first performance question to talk about is results on perfectly stable tanks. Measurements of mature stable systems seem to generate values in the 0.1-0.2 ppm range. Here's @SaltwaterAq measuring 0.19ppm total ammonia on a healthy mature system, and my display that consistently runs zeros on NO3 (and all other inorganic N forms) measured 0.15, and 0.14 (not near feeding times) on two different days.
Since a stable mature system is almost everybody, some clarity here is helpful as to whether our tanks are actually generating a couple of tenths of total ammonia by constant churn of remineralization of food, or if this is simply a test kit artifact.
A simple way to illuminate this is how a mature system handles a known several tenths ppm of ammonia and compare to what the hanna checker is seeing. So I added an expected ~+0.50ppm total ammonia to my display (carefully measured, I already know how my system consumes ammonia, and it was at pH at 7.8, so no real hazard here)

(lots of ammonia-consuming surfaces between the display and the lighted sump)
Blue stars show the baseline measurement, and red shows the values while the spiked ammonia is being consumed.

Here you can see a few features.
1) the expected spike of +0.5ppm ammonia is well measured (actual calibration curve in a later post when I get more reagents).
2) the depletion trend is consistent, and the checker captured very well the mechanics of what's going on.
3) the consumption rate is consistent with the idea that actual ammonia is consumed rapidly in a tank like this: in fact the consumption rate is pretty steady at 0.5, 0.4, 0.3 down to 0.2 ppm ammonia. It makes very little sense to suggest consumption suddenly stops at 0.15ppm.
Instead it is far more likely that the detected 0.1-0.2ppm ammonia that people are measuring is simply a test kit artifact, and very unlikely that tanks deplete ammonia rapidly from 0.5ppm to 0.2ppm then just stop.
This phantom couple of tenths total ammonia will be very familiar to anyone who's seen a bunch of API tests.
Below is what the reacted tests on clear tank water looks like for test results measuring 0.15 ppm.

Notice that both API and hanna generate this blush of "not-quite-yellow" color that people (and now the checker's digital eyeball) misinterpret as an ammonia detection. This is simply an artifact of the test kit chemistry. Compare to what a genuine detection of ~0.5 ppm ammonia looks like below. There is no confusion or ambiguity.

There are some chemistry details on the formation of this low level test kit artifact (it's not just people's bad eyes getting fooled), but I'll save it for later.
The short answer is to simply interpret 0.1-0.2ppm readings as zero baseline the same way a slight blush of green on API should be read as zero.
Calibration data for the Hanna Kit is here in post #10
Last edited:


