Oceamo ICP-MS seawater accuracy and precision data

Christoph

Active Member
View Badges
Joined
May 23, 2017
Messages
239
Reaction score
524
Location
Vienna, Austria
Rating - 0%
0   0   0
Dear all,

@Randy Holmes-Farley, as in related threads before: If this has too much of an advertisment character, feel free to delete this posting.

We try to regularly shed light onto the processes that happen within the Oceamo seawater laboratory.

Im having the feeling that this openness is very much appreciated within the community. For this reason I am happy to present some additional data (more will follow soon) :)

Previously we have shown how our ICP-MS measurements hold up against EU certified reference material, or have presented correctness and repeatability data.

A question that is often asked is the accuracy and precision of each individual value on the analysis report:

Good post Christoph.

I have a quick question. What is preventing Oceamo from stating the accuracy and precision for each element in their ICP report?

Below is my answer to Dan. A Quick summary:

The fact we are not presenting error ranges for each result on each report is not because we want to "hide" something from our customers - there is just no reasonable way to do so in a meaningful manner.

Thank you Dan! Unfortunatel you will most likely not like my answer to your question:

Asking for accuracy and precision for every individual element in each individual run is very easy - but to deliver this data in a meaningful way is unfortunately almost impossible.

The CRM/QK data i provided in my first post give a good indication of accuracy and precision (accuracy: how close are we to the specified concentration, precision: how high is the variability between results).

I could now take this data and say (just as example) for arsenic we have a %RSD of 6,5% (calculated from the standard deveation and mean value of above 18 data points). This 6,5% RSD would however not be valid in general for arsenic. If the concentration of arsenic in the sample would be higher, the %RSD would be lower (better statistics) - if the arsenic concentration would be lower, it would be the other way round. Also factors such as salinity have an impact, if a sample would have very high salinity, %RSD would generally be higher.

To provide precision data for each individual analyses it would be rquired to run every sample several times to allow for statistics. This is however very time consuming, and would thus also increase cost very significantly. It is impossible to give data on accuracy for each individual result, because i do not know the actual ("true") concentration. - Accuracy can only be checked with CRMs or other control samples (data shown in my initial post).

However, i do fully understand that customers would like to have knowledge of what typical accuracy and precision to expect from our results.

For this reason we have measured seawater control samples and CRMs of known composition.

Typically control samples with 3 different concentrations for each analyte were measured in triplicate on 3 individual measurement days. So the correctness, the measurement-to-measurement (same day) repeatability as well as the day-to-day repeatability can be evaluated and visually shown.

Since this dataset is very large, i have attached a PDF file, but would like to explain the data here on one example:

__________________________________________

This is data for Nickel, a known essential trace element.

Nickel

Method:
ICP-MS (here we describe where this data is coming from - not all elements/ions can be measured with ICP-MS directly)

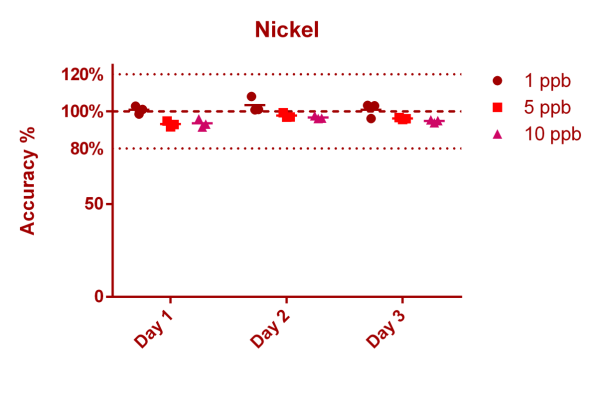
Mean accuracy @ 1 ppb: 101,70 (±3,32)% (9 Measurements split over 3 days)

Mean accuracy @ 5 ppb: 95,70 (±2,26)% (9 Measurements split over 3 days)

Mean accuracy @ 10 ppb: 95,05 (±1,85)% (9 Measurements split over 3 days)

Mean accuracy @ 1,04 ppb: 105,36 (±6,02)% (18 Measurements on 18 consecutive days, CRM data)

We measured 3 different control samples containing nickel at 1 ppb (µg/l), 5 ppb and 10 ppb concentration levels. Each point in the graph below represents a single measurement result. You can see that we measured all nickel control samples 3 times on 3 different days. 100% (on the Y axis) means, that the measurement result matched the known concentration of the control sample exactly (the best case scenario)

If for example the value is 90% at the 1 ppb level this would mean that the actual measurement result was 0.9 ppb (instead of the 1 ppb that the solution actually has).

The "Mean accuracy" values presented above for each concentration level are average % levels across all data points for the given concentration level, thus representing how well we do measure the correct concentration. The ± value represents the standard deviation of those % levels and indicates the spread of the results (the lower the better).


In addition in the second graph also the CRM data is shown (European certified reference material; not available for all analytes). Here we are showing one data point per measurement day (18 consecutive measurement days total, spread over several weeks). Again the mean accuracy and standard deviation were calculated as noted above.

Nickel.png

Nickel CRM [Ni 1,04 ppb CRM].png

__________________________________________

I hope that this posting is useful to better judge results on our analysis reports.


If you are having any questions, i am happy to answer them!

Best regards, and have a nice weekend
Christoph

Nickel CRM [Ni 1,04 ppb CRM].png
 

Attachments

  • Oceamo_ICP-MS_Accuracy_Precision.pdf
    5.6 MB · Views: 73

jonnyglass

New Member
View Badges
Joined
Jan 20, 2023
Messages
17
Reaction score
16
Location
Mars
Rating - 0%
0   0   0
I'm no expert in this, but assuming normal distribution, aren't there statistical methods to determine the number of measurements necessary to calculate a specific confidence interval, say 95%? That to me would be more useful than just the measurement. A range that we can be 95% confident represents the actual value.
 

Dan_P

5000 Club Member
View Badges
Joined
Sep 21, 2018
Messages
6,684
Reaction score
7,175
Rating - 0%
0   0   0
Dear all,

@Randy Holmes-Farley, as in related threads before: If this has too much of an advertisment character, feel free to delete this posting.

We try to regularly shed light onto the processes that happen within the Oceamo seawater laboratory.

Im having the feeling that this openness is very much appreciated within the community. For this reason I am happy to present some additional data (more will follow soon) :)

Previously we have shown how our ICP-MS measurements hold up against EU certified reference material, or have presented correctness and repeatability data.

A question that is often asked is the accuracy and precision of each individual value on the analysis report:


Below is my answer to Dan. A Quick summary:

The fact we are not presenting error ranges for each result on each report is not because we want to "hide" something from our customers - there is just no reasonable way to do so in a meaningful manner.


However, i do fully understand that customers would like to have knowledge of what typical accuracy and precision to expect from our results.

For this reason we have measured seawater control samples and CRMs of known composition.

Typically control samples with 3 different concentrations for each analyte were measured in triplicate on 3 individual measurement days. So the correctness, the measurement-to-measurement (same day) repeatability as well as the day-to-day repeatability can be evaluated and visually shown.

Since this dataset is very large, i have attached a PDF file, but would like to explain the data here on one example:

__________________________________________

This is data for Nickel, a known essential trace element.

Nickel

Method:
ICP-MS (here we describe where this data is coming from - not all elements/ions can be measured with ICP-MS directly)

Mean accuracy @ 1 ppb: 101,70 (±3,32)% (9 Measurements split over 3 days)

Mean accuracy @ 5 ppb: 95,70 (±2,26)% (9 Measurements split over 3 days)

Mean accuracy @ 10 ppb: 95,05 (±1,85)% (9 Measurements split over 3 days)

Mean accuracy @ 1,04 ppb: 105,36 (±6,02)% (18 Measurements on 18 consecutive days, CRM data)

We measured 3 different control samples containing nickel at 1 ppb (µg/l), 5 ppb and 10 ppb concentration levels. Each point in the graph below represents a single measurement result. You can see that we measured all nickel control samples 3 times on 3 different days. 100% (on the Y axis) means, that the measurement result matched the known concentration of the control sample exactly (the best case scenario)

If for example the value is 90% at the 1 ppb level this would mean that the actual measurement result was 0.9 ppb (instead of the 1 ppb that the solution actually has).

The "Mean accuracy" values presented above for each concentration level are average % levels across all data points for the given concentration level, thus representing how well we do measure the correct concentration. The ± value represents the standard deviation of those % levels and indicates the spread of the results (the lower the better).


In addition in the second graph also the CRM data is shown (European certified reference material; not available for all analytes). Here we are showing one data point per measurement day (18 consecutive measurement days total, spread over several weeks). Again the mean accuracy and standard deviation were calculated as noted above.


Nickel.png

Nickel CRM [Ni 1,04 ppb CRM].png

__________________________________________

I hope that this posting is useful to better judge results on our analysis reports.


If you are having any questions, i am happy to answer them!

Best regards, and have a nice weekend
Christoph

Nickel CRM [Ni 1,04 ppb CRM].png
Thank you Christoph for sharing this information and the time to share your thoughts. What happened to the third calibration point for iodine?

Just to clarify what you shared, I assume three standards solutions were prepared for each element and either made fresh for each calibration or stored in a manner that minimized degradation between tests. For the 38 element times three concentrations measured by ICP-MS, I assume these were not all run on the same day.

I also assume that out of curiosity you never mailed a sample of the calibration solutions to yourself to understand the effect that variable temperature had on your non-stabilized standard solutions.

Dan
 

Randy Holmes-Farley

Reef Chemist
View Badges
Joined
Sep 5, 2014
Messages
67,391
Reaction score
63,732
Location
Arlington, Massachusetts, United States
Rating - 0%
0   0   0
I also assume that out of curiosity you never mailed a sample of the calibration solutions to yourself to understand the effect that variable temperature had on your non-stabilized standard solutions.

Dan

Time in container at various temps is a concern, IMO.

I asked Triton a few years ago to freeze a sample and see if anything changes, and they said it did not, but a second test of that would be useful. Slowly frozen very cold as might happen in a mail truck in Minnesota USA in January.

As seawater freezes, it is freshwater ice and more and more concentrated salt solution and solid precipitates. At some point, something might precipitate from that cold, hypersaline solution, that does not redissolve.

It seems the unusual form of calcium carbonate that forms may redissolve as it warms, but I am still skeptical that everything else does as well.
 

Dan_P

5000 Club Member
View Badges
Joined
Sep 21, 2018
Messages
6,684
Reaction score
7,175
Rating - 0%
0   0   0
Time in container at various temps is a concern, IMO.

I asked Triton a few years ago to freeze a sample and see if anything changes, and they said it did not, but a second test of that would be useful. Slowly frozen very cold as might happen in a mail truck in Minnesota USA in January.

As seawater freezes, it is freshwater ice and more and more concentrated salt solution and solid precipitates. At some point, something might precipitate from that cold, hypersaline solution, that does not redissolve.

It seems the unusual form of calcium carbonate that forms may redissolve as it warms, but I am still skeptical that everything else does as well.
I totally agree. We cannot “arm chair” our way to an answer.

Mailing a non-stabilized water sample for testing is never done by professionals. I am OK not following SOP’s or best practices to save a buck as long as I understand the loss of information that occurs. No ICP vendor has ever provided this information about their service. My hope is that we can convince Christoph to provide this data or at least volunteer to split the cost with us to show the true effect of shipping on accuracy and precision. At this point I would be happy to hear why ICP vendors think shipping has little effect.
 
OP
OP
Christoph

Christoph

Active Member
View Badges
Joined
May 23, 2017
Messages
239
Reaction score
524
Location
Vienna, Austria
Rating - 0%
0   0   0
Hello everyone,

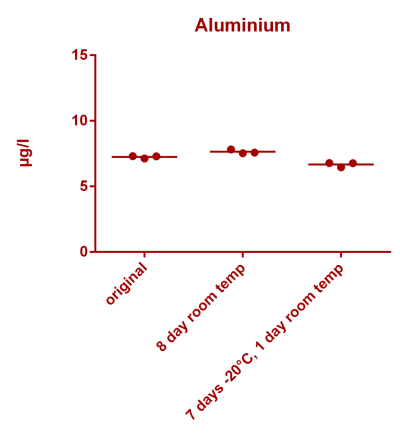
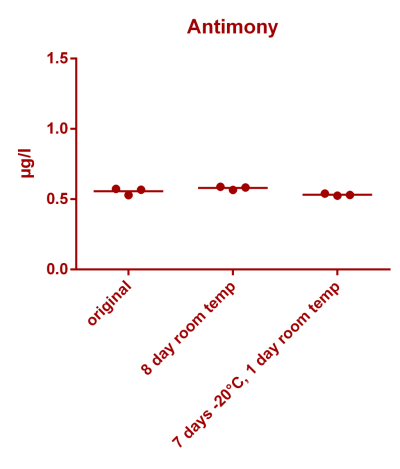
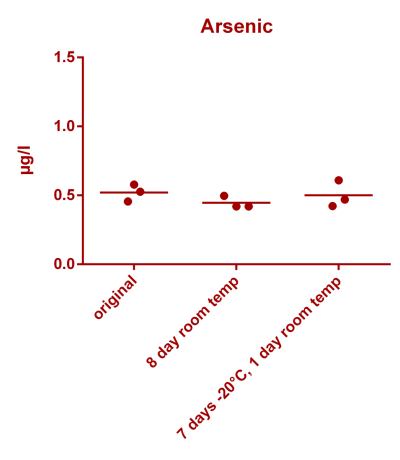
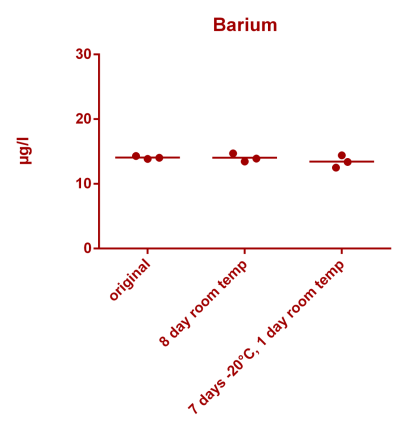
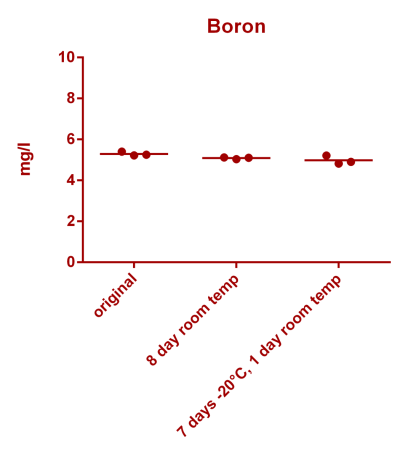
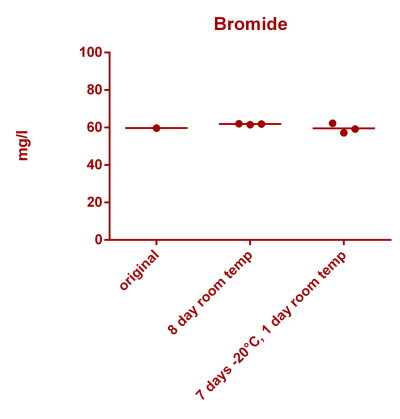
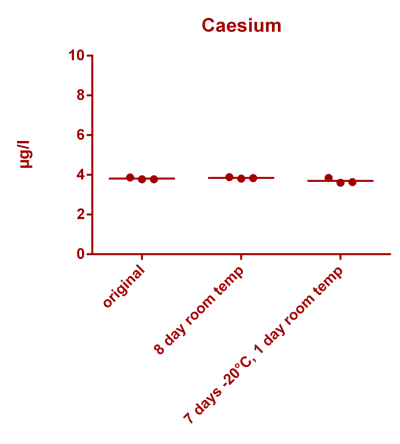
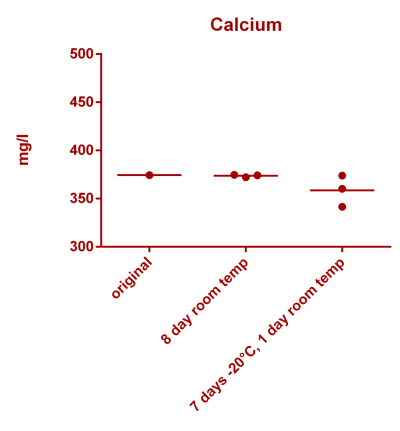
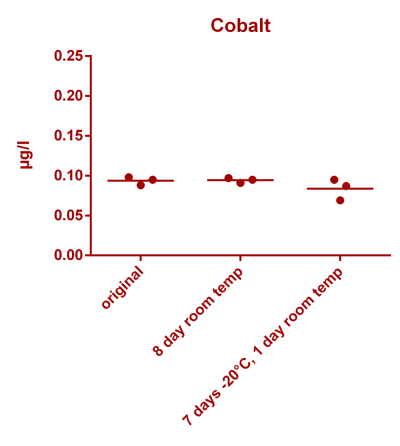
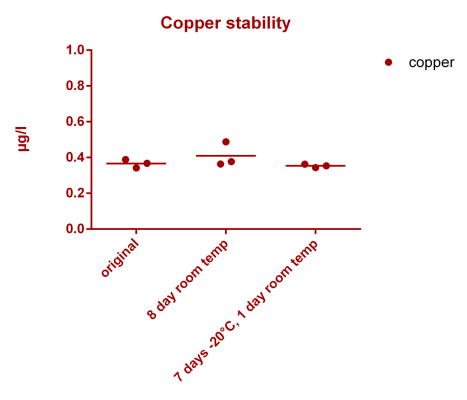
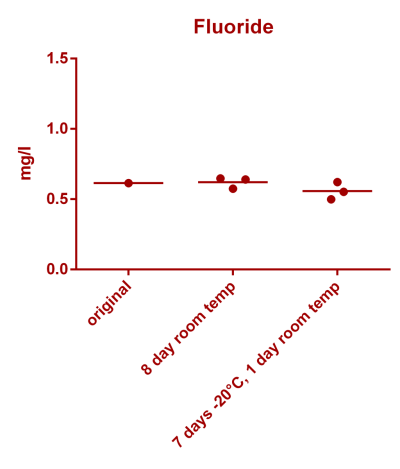
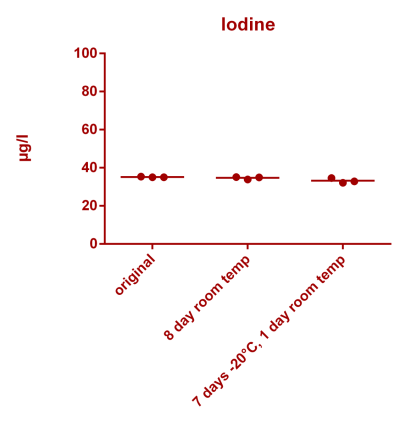
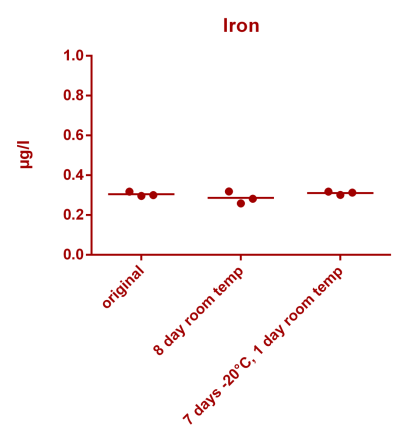
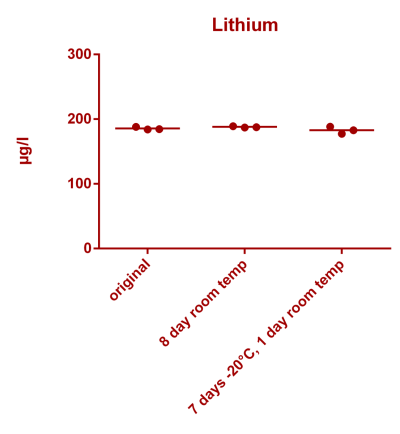
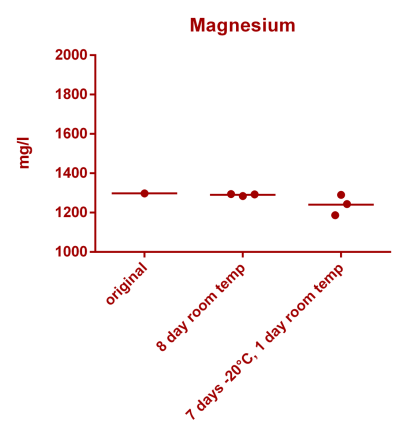
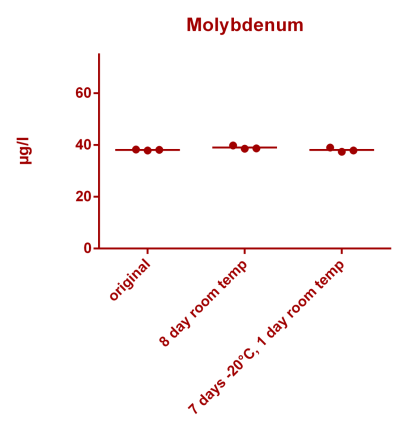
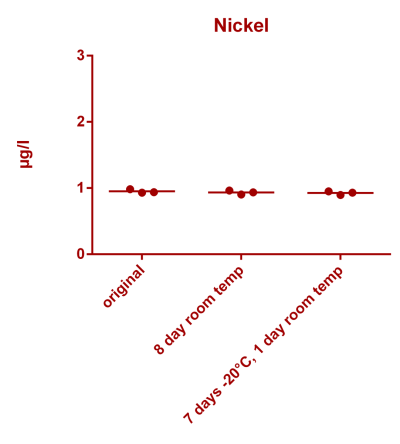
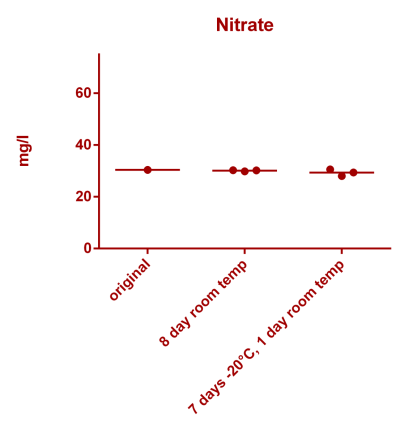
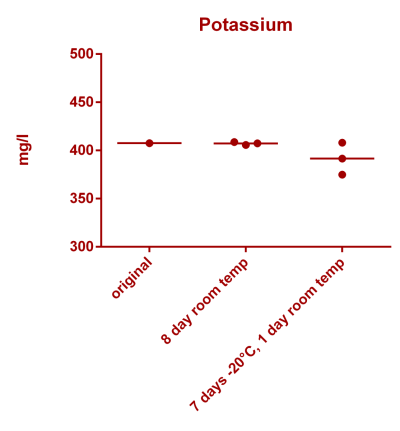
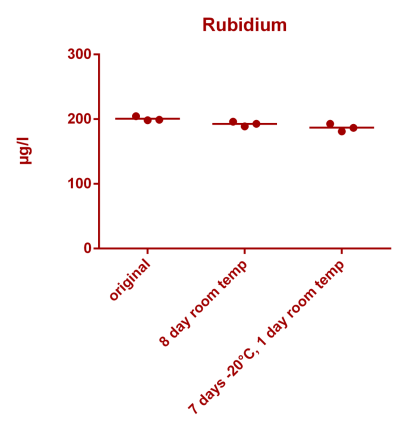
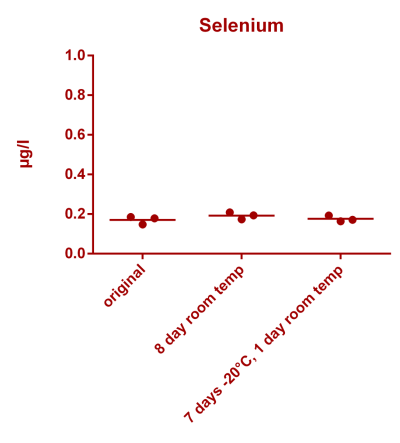
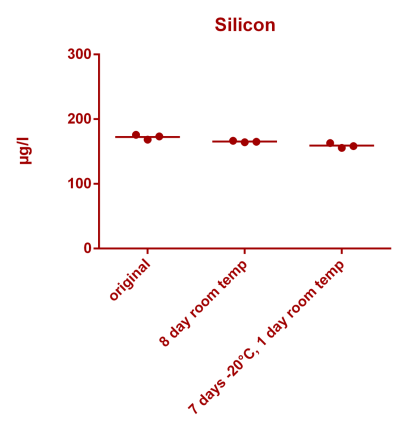
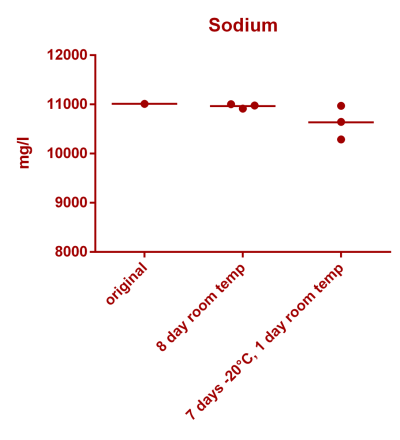
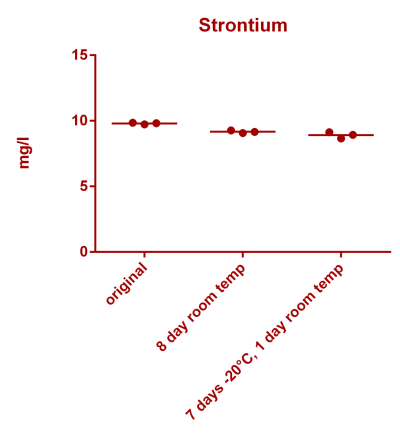
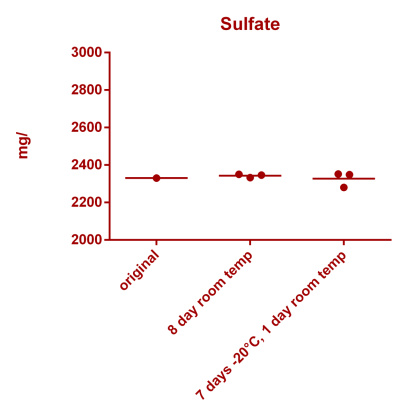
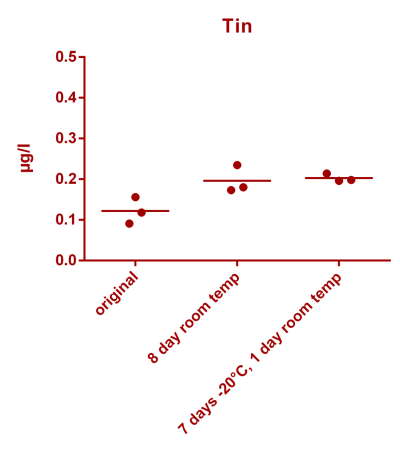
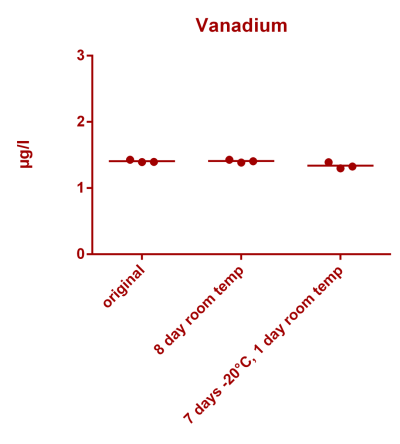
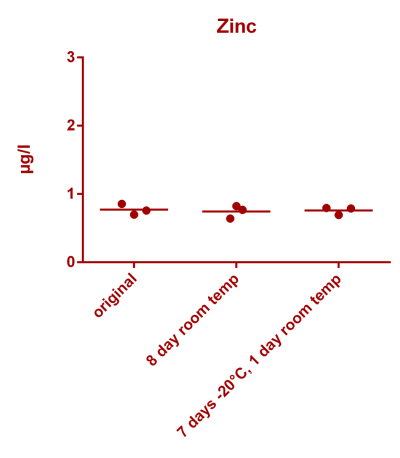
as already promised in my first post, morr data will follow soon - so here we go. This data is to adress specifically sample stability at ambient and low temperatures. That is a question that is often raised.
but a second test of that would be useful. Slowly frozen very cold as might happen in a mail truck in Minnesota USA in January.

Short explanation of the experimental series:

Original:
Sample measured within 60 min after taken from a reef tank. The sample is "natural", so no element spikes have been added. For this reason we cannot show data for all elements (some were not present above our limit of detection).
8 day room temp: Sample stored 8 days at room temperature (~19-22°C) prior to analysis
7 days -20°C, 1 day room temp: Sample stored for 7 days in the freezer (-20°C) and one day at room temperature prior to analysis

All samples taken at the same time in triplicate and also analyzed in triplicate (individual tubes). Exception here are the Ion chromatography elements: Here we are just having a single data point for the "Original" sample. Alkalinity and phosphate were not measured within this series.

Analysis performed: Oceamo ICP-MS seawater analysis

My conclusion: The 8 day ambient storage does not have any significant impact on any of the assayed parameters. The freezing has no significant impact on the majority of parameters (including the ultratrace elements present well below 1 µg/l). - However the freezing causes a broader variation/spread in results from tube to tube, which is more pronounced with the macroelements Ca, Mg, Na and K. Still in my opinion the "take home messages" that can be drawn based on the results are also not affected by freezing of the sample.

The mechanism for the broader result variation in the frozen sample is also not yet 100% clear to me. One would expect carbonate or sulfate precipitation, which is likely not the case here (since Na and K would not precipitate, also sulfate is not affected - also Barium and Strontium are unaffected). @Randy Holmes-Farley , maybe you are having an idea.

I hope again that this is useful to you!
all the best,
Christoph


Aluminium stability.png

Antimony stability.png

Arsenic stability.png
Barium stability.png
Boron stability.png

Bromide stability.png

Caesium stability.png
Calcium stability.png
Cobalt stability.png

Copper stability.png

Fluoride stability.png
Iodine stability.png
Iron stability.png
Lithium stability.png
Magnesium stability.png
Molybdenum stability.png
Nickel stability.png
Nitrate stability.png
Potassium stability.png
Rubidium stability.png
Selenium stability.png
Silicon stability.png
Sodium stability.png
Strontium stability.png
Sulfate stability.png
Tin stability.png
Uranium stability [copper].png
Vanadium stability.png
Zinc stability.png
Uranium stability [copper].png
 

Tony Thompson

Active Member
View Badges
Joined
Jul 17, 2016
Messages
456
Reaction score
1,002
Location
North East England
Rating - 0%
0   0   0
Hi @Christoph , thanks for being open and informative, very much appreciated. I will be following the conversation with interest.

On another topic whilst you are here, do you still offer the ICP and eDNA service in the UK, I cant find a UK distributor anymore.
 

Tony Thompson

Active Member
View Badges
Joined
Jul 17, 2016
Messages
456
Reaction score
1,002
Location
North East England
Rating - 0%
0   0   0
@Christoph Thanks for the message. I was not expecting a reply this late at night.

More on topic of the thread.

The EU standards I would think are a practical way to explore accuracy and precision for the selected elements.

However what are your thoughts on the possible variations caused by organic interaction between identical samples (taken from the same aquarium) .

Should the customer take consideration for interactions within the composition of the sample during collection and shipping.

What are the protocols or filters deployed both in collection and pre testing, for mitigating such transformation and more importantly how this may effect the instrumentation.
 

Dan_P

5000 Club Member
View Badges
Joined
Sep 21, 2018
Messages
6,684
Reaction score
7,175
Rating - 0%
0   0   0
My conclusion: The 8 day ambient storage does not have any significant impact on any of the assayed parameters. The freezing has no significant impact on the majority of parameters (including the ultratrace elements present well below 1 µg/l). - However the freezing causes a broader variation/spread in results from tube to tube, which is more pronounced with the macroelements Ca, Mg, Na and K. Still in my opinion the "take home messages" that can be drawn based on the results are also not affected by freezing of the sample.
Christoph, thank you for performing this experiment. You are my secret Santa.

Following Occam’s Razor, the simplest explanation is that all elements are affected by cold storage but the confidence interval for the various test methods only permits detection in changes of the higher concentration elements.

I have not estimated a 95% confidence interval from your calibration data but will propose that the ICP-MS method is not going to reliably detect concentration changes of less than 10%.

As for question of why the change occurred upon freezing the sample is better left to debate. I will point out that while the freezing effect seems real, there was no room temperature or acid stabilized controls to make the conclusion definite.
 
OP
OP
Christoph

Christoph

Active Member
View Badges
Joined
May 23, 2017
Messages
239
Reaction score
524
Location
Vienna, Austria
Rating - 0%
0   0   0
Hello Dan,
I will point out that while the freezing effect seems real, there was no room temperature or acid stabilized controls to make the conclusion definite.
What do you mean there was no room temperature control? Please see the middle column of every graph in my second post.


I have not estimated a 95% confidence interval from your calibration data but will propose that the ICP-MS method is not going to reliably detect concentration changes of less than 10%.

Looking at repeatability (first post as well as repeated measurements from my last post) i will say that even < 10% concentration changes are well detected for many elements, even at very low concentration levels.

Best regards, Christoph
 
OP
OP
Christoph

Christoph

Active Member
View Badges
Joined
May 23, 2017
Messages
239
Reaction score
524
Location
Vienna, Austria
Rating - 0%
0   0   0
@Christoph Thanks for the message. I was not expecting a reply this late at night.

More on topic of the thread.

The EU standards I would think are a practical way to explore accuracy and precision for the selected elements.

However what are your thoughts on the possible variations caused by organic interaction between identical samples (taken from the same aquarium) .

Should the customer take consideration for interactions within the composition of the sample during collection and shipping.

What are the protocols or filters deployed both in collection and pre testing, for mitigating such transformation and more importantly how this may effect the instrumentation.

Hello Tony,

youre most welcome!

im not 100% sure to understand the question correctly.
If you mean potential interferences by particles/organic matter/bacteria - we are trying to eliminate those as good as possible. The sample is directly filtered at the sampling site using a 0,2 µm membrane. This reduces biological activity in the sample drastically and removes all particulates.

In addition phosphate is chemically stabilized, to avoid loss of phosphate during shipping.

Please let me know if your are having additional questions!
Christoph
 

Dan_P

5000 Club Member
View Badges
Joined
Sep 21, 2018
Messages
6,684
Reaction score
7,175
Rating - 0%
0   0   0
Hello Dan,

What do you mean there was no room temperature control? Please see the middle column of every graph in my second post.


Looking at repeatability (first post as well as repeated measurements from my last post) i will say that even < 10% concentration changes are well detected for many elements, even at very low concentration levels.

Best regards, Christoph
Apologies! I misunderstood the storage experiment design. The room temperature storage was done in parallel to cold storage. So the weird results are not a bad dream :)

The repeatability I believe is reported at one sigma. To understand what we can conclude from the experiment, we need to consider that the analytical variation is better described as having variation as large as two or three sigma. With this broader range I feel we cannot conclude the analytical results prove that the trace element concentration did not change.
 
OP
OP
Christoph

Christoph

Active Member
View Badges
Joined
May 23, 2017
Messages
239
Reaction score
524
Location
Vienna, Austria
Rating - 0%
0   0   0
Hello,

With all respect, i would not characterize any of the results as "weird" or a "bad dream".

To sum up we have (to the best of my knowledge as first aquarium water testing company) presented a large dataset, showing that:

1) we can reliably measure the analytes we report
2) point 1 is also true for many elements at very low concentrations of 1 µg/l and below
3) The results reported are close to the true values
4) the interday repeatability of the measured results is good
5) the day-to-day repeatability of the results is good
6) the samples are perfectly stable at ambient temperature for typical shipping timeframes
7) the samples are mostly unaffected even at very low temperatures (-20°C) for 8 days, however larger errors can be expected for some elements

With best regards,
Christoph
 
Last edited:

Dan_P

5000 Club Member
View Badges
Joined
Sep 21, 2018
Messages
6,684
Reaction score
7,175
Rating - 0%
0   0   0
Hello,

With all respect, i would not characterize any of the results as "weird" or a "bad dream".

To sum up we have (to the best of my knowledge as first aquarium water testing company) presented a large dataset, showing that:

1) we can reliably measure the analytes we report
2) point 1 is also true for many elements at very low concentrations of 1 µg/l and below
3) The results reported are close to the true values
4) the interday repeatability of the measured results is good
5) the day-to-day repeatability of the results is good
6) the samples are perfectly stable at ambient temperature for typical shipping timeframes
7) the samples are mostly unaffected even at very low temperatures (-20°C) for 8 days, however larger errors can be expected for some elements

With best regards,
Christoph
With an equal amount of respect, I want to point out that even with points 1-7, Oceamo, like other UCP vendors, cannot make the simple guarantee that it will measure element concentrations to 95% accuracy with a variation of 5% (two standard deviations), or whatever accuracy and precision.

The information we have so far is still mostly that the instrument remains calibrated for an extended time, which is certainly part of the foundation for a quality service. This, however, does not help me decide whether two measurements made a month apart are statistically different.

The question still remains about Oceamo service. How accurately can it measure 6 identical samples containing a mixture of certified elements in aquarium water, 3 of which have been measured immediately and 3 that were shipped to themselves before measuring. I suggest aquarium water to ensure the matrix has organic material in solution. Six additional measurements would be important, three of the aquarium water before the elements were added and three of the aquarium water after the standards are added to ensure that the additions went according to plan and that there is nothing unusual about the matrix (not a great control, but maybe sufficient).


Dan
 

taricha

5000 Club Member
View Badges
Joined
May 22, 2016
Messages
6,547
Reaction score
10,108
Rating - 0%
0   0   0
Just going through this data. It's really great. Thanks Christoph for providing data that hobbyists have been trying to extract from vendors at fairly large cost.

The tank water on same day vs held for a week in particular is one that we've wanted quite a bit. Can you clarify if the ambient storage was done with your normal sampling procedures - filtration etc, then in the tube and then stored for 8 days, or was the tank water stored for 8 days before the typical sample processing? (too bad PO4 didn't make it into the results.)

On the major ion freezing weirdness... As the tube freezes, the ice formed is mostly freshwater, so there is a tiny amount of increasingly saline liquid that gets physically separated. If some tiny amount was lost in this highly concentrated portion, it might explain the loss of major ions. (the errors in the data are only downward - none upward). Also depending on how the samples were treated after thawing, the supersaline part might not have gotten uniformly re-mixed into the thawed mostly freshwater part.
More ideas on the meat of the data later.
 

Randy Holmes-Farley

Reef Chemist
View Badges
Joined
Sep 5, 2014
Messages
67,391
Reaction score
63,732
Location
Arlington, Massachusetts, United States
Rating - 0%
0   0   0
Thank you for the data and experiment, Christoph!

If every company serving hobbyists supplied the same level of info and testing of their products and services, I'd probably have time for a reef tank again. lol

Anyway, one other thought and question. Perhaps you or one of us could do a similar freezing experiment and measure the alkalinity before and after.

If, on freezing, there is any precipitation of calcium and magnesium as a carbonate that does not redissolve, then that is most easily seen by alk. A 50% drop in the alk of 7 dKH seawater would only cause a 25 ppm drop in calcium or a 15 ppm drop in magnesium.
 
OP
OP
Christoph

Christoph

Active Member
View Badges
Joined
May 23, 2017
Messages
239
Reaction score
524
Location
Vienna, Austria
Rating - 0%
0   0   0
Hi everyone,

sorry for the long silence, its been busy weeks.

The data i present today was actually collected already a few weeks back. The mystery that we were having is that the concentration of several major elements declined when the samples were stored at freezing temperatures, to mimick shipping during winter (see posts above). This seemed strange and hard to explain, since also ions like potassium and sodium were affected, that do usually not precipitate at all.

On the major ion freezing weirdness... As the tube freezes, the ice formed is mostly freshwater, so there is a tiny amount of increasingly saline liquid that gets physically separated. If some tiny amount was lost in this highly concentrated portion, it might explain the loss of major ions. (the errors in the data are only downward - none upward).

Thank you taricha for you commentary. It turns out that exactly this is the case.

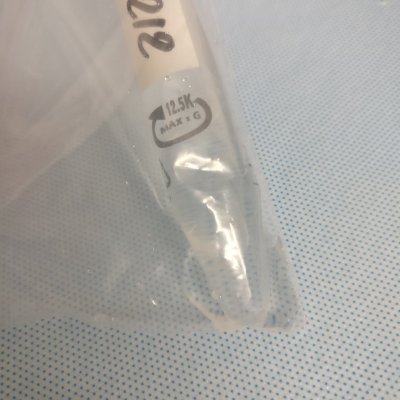
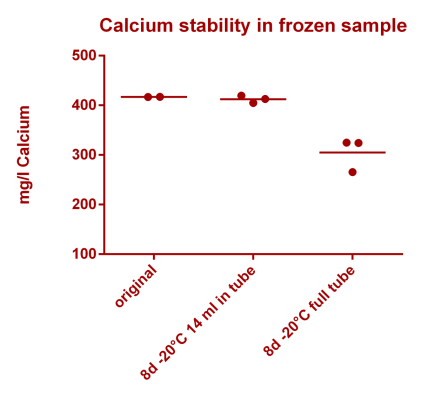
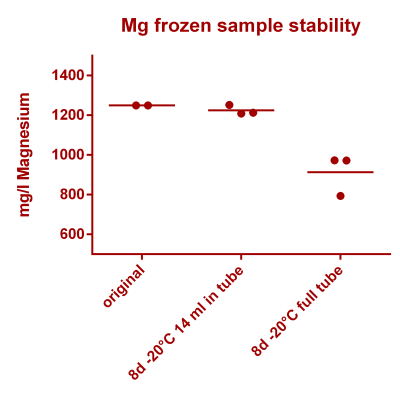
We have started another "frozen sample series", with a) tubes being filled completely with sample water (no air cushion) and b) tubes filled only to the 14 ml mark (1-2 ml of air cushion inside the tubes). Tubes were stored at freezing -20°C (-4 Fahrenheit) for 8 days, thawed, homogenized and analyzed.

IMG_20231219_173052.jpg

As you can see clearly in this picture, liquid has been pushed out the tubes that have been filled completely with sample, while this was not the case with the tubes that had some residual air.

Looking at the analysis results, we see a deviation of results in the "completely filled tube" series compared to the original data - this was not the case with the frozen samples that had the air cushion inside.


Ca.png
Mg (2).png

Na stbility 2 [Na frozen sample stability].png

potassium stability 2 [Potassium frozen sample stabil]-1.png

We also measured the concentration of major ions in the "leaked fraction" , and not too surprising, concentrations were very high (K, Ca ~2000, Mg ~7500, Na 55000 mg/l) - During freezing einrichment takes place in the liquid phase, which is pushed out of the tube because of expansion (and non-compressibility of the liquid/ice). Because of the high ion concentration in the residual iquid phase, even a small leakage can have a significant effect on the residual sample after thawing.


Levels in leaked liquid [Na frozen sample stability].png
So once more, physics is causing the issues, not chemistry ;-) (i apologize to all offended physicists :))

What is the take home mesage here: Do not fill your sample tubes completely. Leave some air inside them, and very cold temperature will not cause a change in your sample composition. We have also updated our sampling instructions to include this specific information.

I would also like to update the list i have posted above, to conclude what we have shown in this thread:

1) we can reliably measure the analytes we report
2) point 1 is also true for many elements at very low concentrations of 1 µg/l and below
3) The results reported are close to the true values
4) the interday repeatability of the measured results is good
5) the day-to-day repeatability of the results is good
6) the samples are perfectly stable at ambient temperature for typical shipping timeframes
7) the samples are mostly unaffected even at very low temperatures (-20°C) for 8 days, however larger errors can be expected for some elements when the vials are filled only ~90% full.

All the best,
Christoph K.png Na stbility 2 [Na frozen sample stability].png potassium stability 2 [Potassium frozen sample stabil]-1.png Levels in leaked liquid [Na frozen sample stability].png
PS.: @admins: For some reason the graphs are inserted again at the bottom of the post, and i am not able to remove them. They always re-appear on saving the edited post. Maybe someone could remove them. Thank you! Na stbility 2 [Na frozen sample stability].png potassium stability 2 [Potassium frozen sample stabil]-1.png Levels in leaked liquid [Na frozen sample stability].png
 
Last edited:

Randy Holmes-Farley

Reef Chemist
View Badges
Joined
Sep 5, 2014
Messages
67,391
Reaction score
63,732
Location
Arlington, Massachusetts, United States
Rating - 0%
0   0   0
Thank you very much, Christoph. Certainly a logical issue.

I do not know what people usually do in terms of fill, but I think this is important enough to put a warning in the main forum, which I will do now. :)
 

Randy Holmes-Farley

Reef Chemist
View Badges
Joined
Sep 5, 2014
Messages
67,391
Reaction score
63,732
Location
Arlington, Massachusetts, United States
Rating - 0%
0   0   0
 

Reefing threads: Do you wear gear from reef brands?

  • I wear reef gear everywhere.

    Votes: 20 13.3%
  • I wear reef gear primarily at fish events and my LFS.

    Votes: 10 6.7%
  • I wear reef gear primarily for water changes and tank maintenance.

    Votes: 1 0.7%
  • I wear reef gear primarily to relax where I live.

    Votes: 23 15.3%
  • I don’t wear gear from reef brands.

    Votes: 85 56.7%
  • Other.

    Votes: 11 7.3%

New Posts

Back
Top