

Comparing Organo-MS results across five different reef tanks

  • Thread starter Thread starter jeremie
  • Start date Start date
  • Tagged users Tagged users None

jeremie

Active Member
View Badges
Joined
Oct 19, 2019
Messages
109
Reaction score
95
Rating - 0%
0   0   0
I recently received the Organo-MS and ICP-MS results from five reef tanks under my care. Although I don't think many firm conclusions can be drawn from only five samples, I still find it quite interesting to compare these data with some more detailed information about the tanks.

Here's some information about the tanks:

(1) All of the tanks were a little over 2 years old, although most of the rock and substrate came from older tanks.
(2) No filter media other than the rock and substrate in the display had been used during the three months before sampling.
(3) Three tanks had only a skimmer in the sump, while the other two did not even have a skimmer, just an empty sump with water flowing through it.
(4) No amino acids were dosed in any of these tanks.
(5) There was no deliberate coral feeding. The fish were fed pellets and frozen mysids.
(6) None of the tanks had detectable nitrate or nitrite.

1. tank1
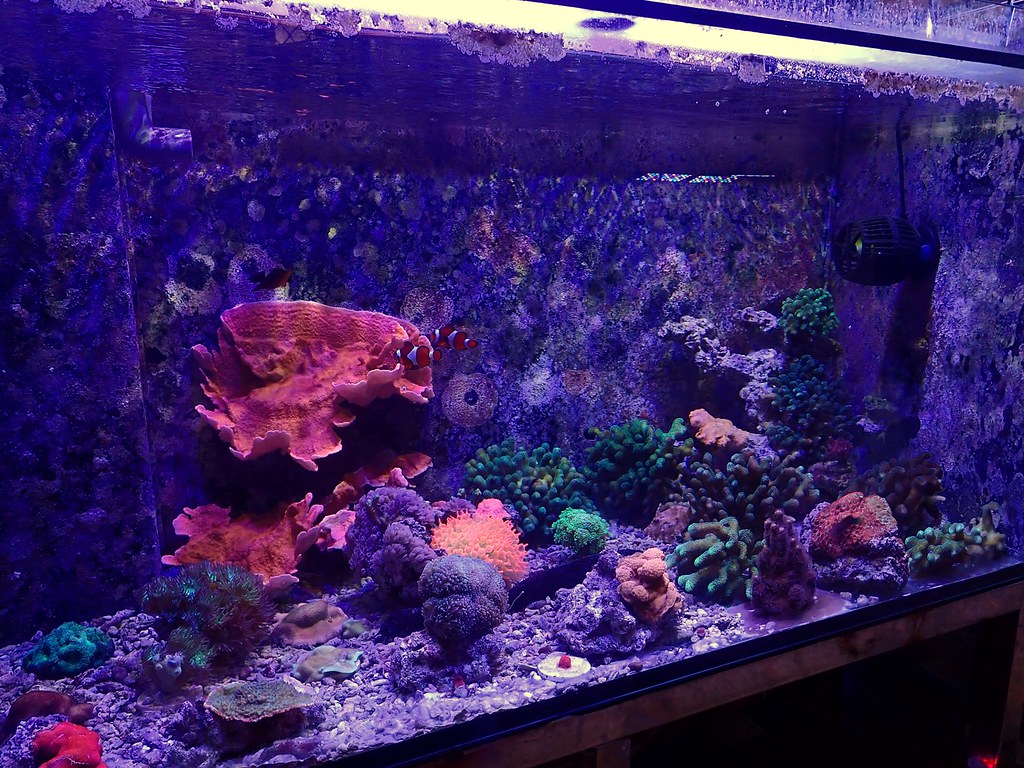
Skimmer: Yes
Dosing: All-For-Reef, sodium monobasic phosphate, ammonium bicarbonate
Water change: 20–30% every 1–3 months
Substrate: 1 inch of crushed coral

The tank is a mixed reef dominated mostly by stony corals, with a lot of Stylophora pistillata. Alkalinity consumption was about 1.5 dKH per day. The tank had been treated with fluconazole and oxolinic acid 7 months before sampling, and ciprofloxacin 3 months before sampling, to deal with a hair algae bloom and a coral disease outbreak.

2. tank2
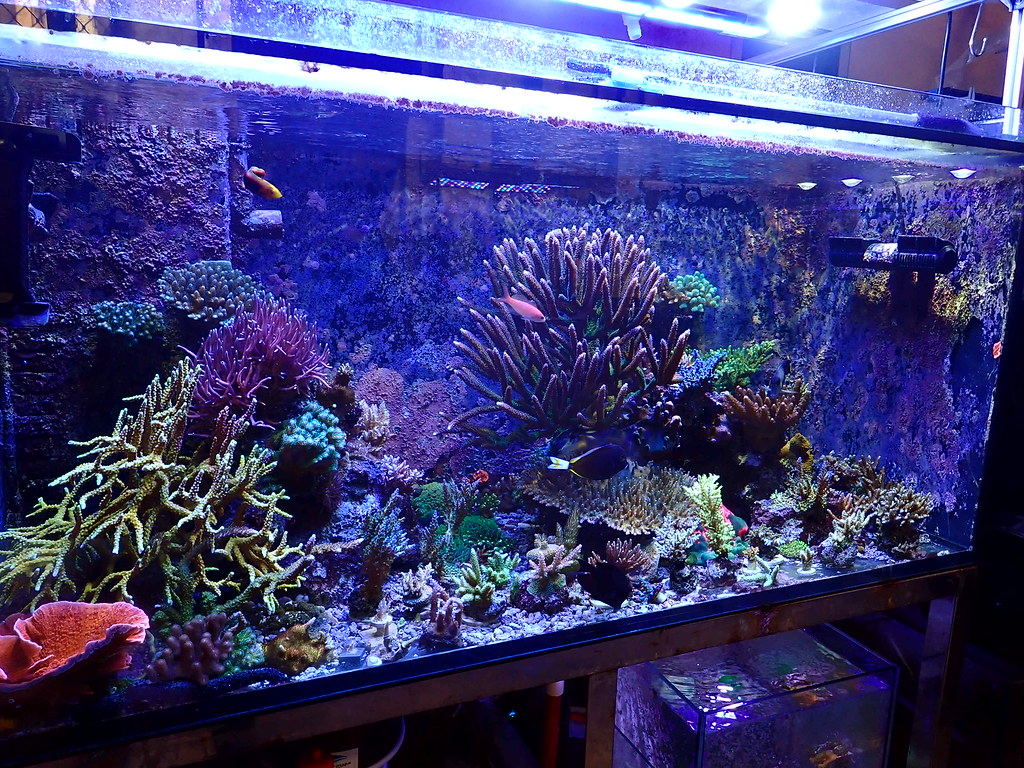
Skimmer: Yes
Dosing: DIY two-part, Tropic Marin A- & K+, sodium monobasic phosphate, ammonium bicarbonate
Water change: 20–30% every 1–3 months
Substrate: 1 inch of crushed coral

The tank is an SPS-dominated reef. Alkalinity consumption was about 4 dKH per day. The tank had been treated with milbemycin oxime 7 months before sampling to treat parasitic copepods on Acropora spp.

3. tank3
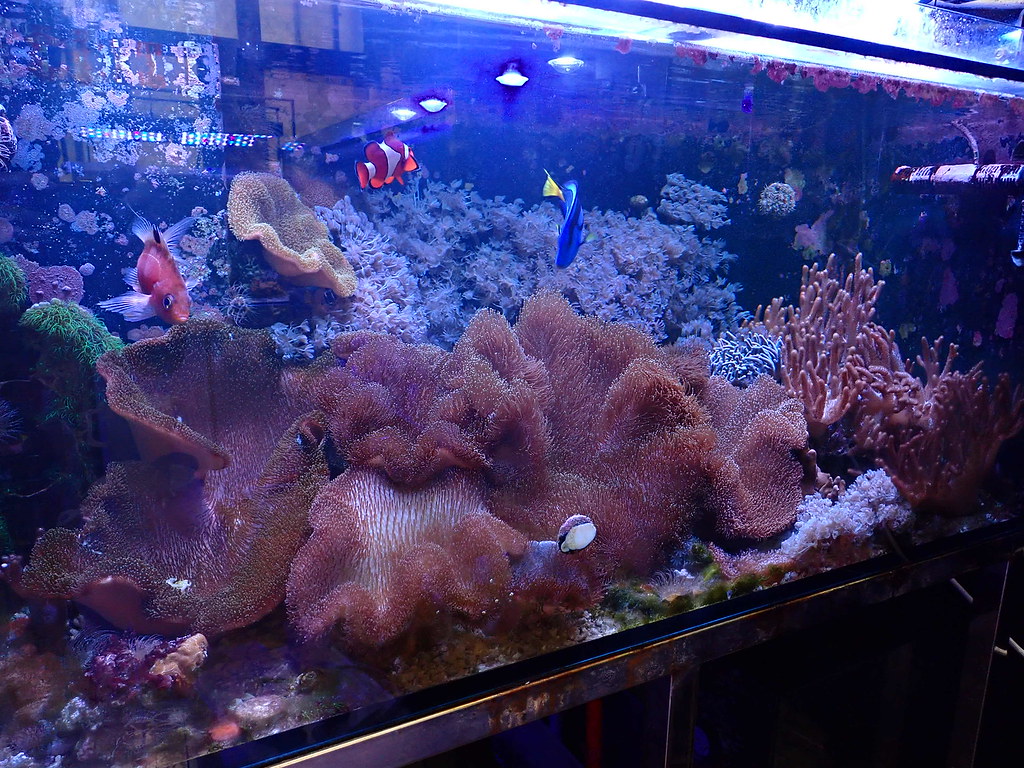
Skimmer: No
Dosing: Kalkwasser, magnesium chloride
Water change: No water changes for at least a year
Substrate: 1 inch of crushed coral

The tank is a soft coral-dominated reef. Alkalinity consumption was about 0.5 dKH per day.

4. tank5
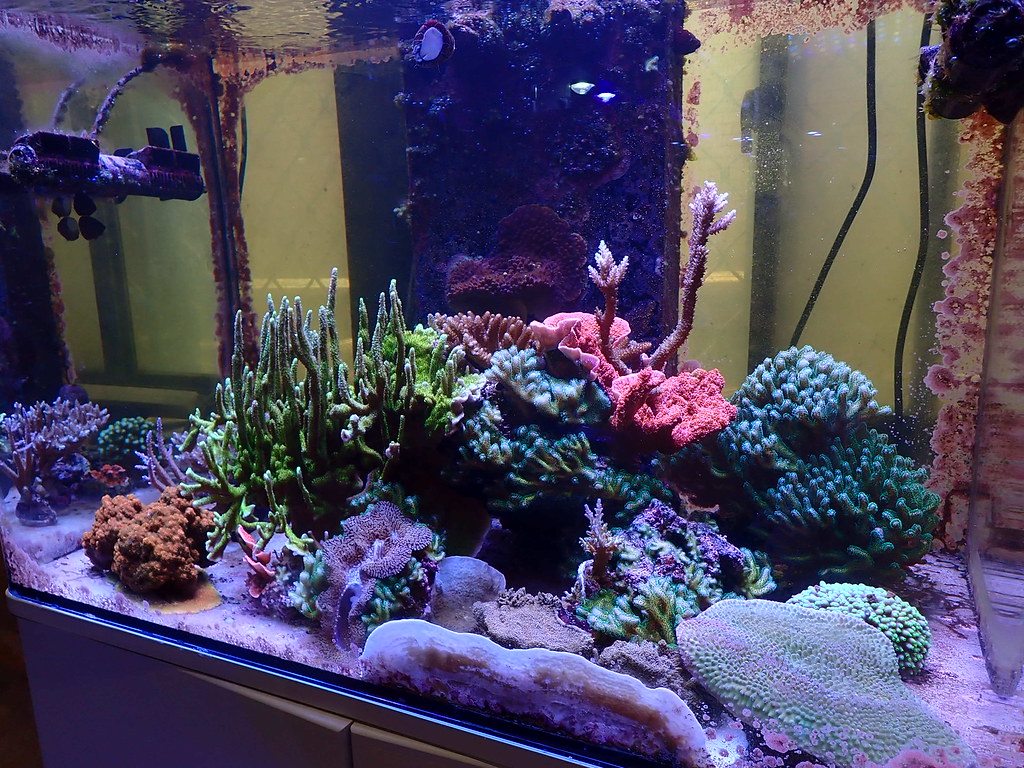
Skimmer: Yes
Dosing: DIY two-part, Tropic Marin A- & K+, sodium monobasic phosphate, ammonium bicarbonate, sodium nitrate (occasional boost)
Water change: 20–30% every 1–3 months
Substrate: Bare bottom

The tank is an SPS-dominated reef. Alkalinity consumption was about 4 dKH per day.

5. 4F tank
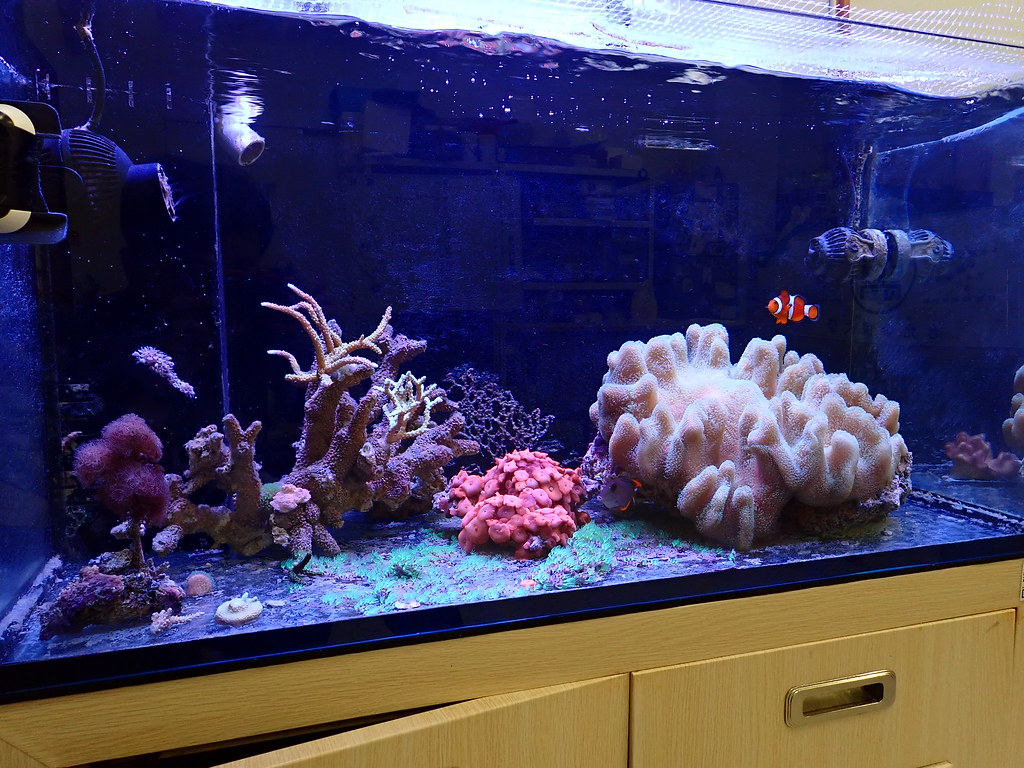
Skimmer: No
Dosing: All-For-Reef, sodium monobasic phosphate, ammonium bicarbonate
Water change: No water changes for at least a year
Substrate: Bare bottom

The tank is a mixed reef, but most of the coral biomass is probably contributed by the large Sarcophyton. The tank has experienced occasional bacterial blooms for no apparent reason ever since it was set up. Alkalinity consumption was about 0.1 dKH per day.


Amino acids

Most of the tanks showed a fairly similar overall pattern, characterized by high glycine and aspartic acid concentrations (Figure 1). I then calculated the total amino acid nitrogen concentration in these tanks, with 4F and tank3 having the highest concentrations (Figure 2). The proportion of total amino acid nitrogen contributed by each amino acid was then calculated (Figure 3). Interestingly, in the 4F tank, which had the highest total amino acid nitrogen concentration, the proportions of nitrogen contributed by aspartic acid and glycine were lower than in the other tanks.

1786129336986.png

Figure 1. Concentrations of different amino acids in five reef tanks

1786129712163.png

Figure 2. Total amino acid nitrogen in five reef tanks

1786129562356.png

Figure 3. Proportion of total amino acid nitrogen contributed by different amino acids in five reef tanks


Principal component analysis (PCA) of amino acid data

PCA is a dimensionality-reduction method that transforms a high-dimensional dataset, such as the amino acid concentrations and proportions here, into a lower-dimensional representation, in this case, two dimensions, for easier visualization. It is somewhat similar to projecting the shadow of your hand (a 3D object) onto a flat surface under a light source. The 2D shadow still preserves some useful characteristics of the original object. PCA basically finds the directions that capture the greatest amount of variation in the original dataset and represents the samples along these new axes. Here, the data are reduced to two axes, PC1 and PC2, which capture most of the variation among the samples.

I performed PCA on the amino acid mole fraction and molar concentration data (Figures 4 and 5). In both plots, 4F is farther away from the other tanks along the PC1 axis, which explains most of the variation in both analyses (63.44% and 70.12%). Figure 6 also shows the vectors for each amino acid in the mole-fraction PCA. The separation of 4F from the other tanks appears to be mostly associated with higher proportions of arginine, leucine + isoleucine, phenylalanine, tyrosine, and valine, while tank3 seems to be characterized by higher proportions of glycine and serine.

Amino acid mole fraction.png

Figure 4. PCA plot of amino acid mole fractions in five reef tanks

newplot (1).png

Figure 5. PCA plot of amino acid concentrations in five reef tanks


Figure 6. PCA plot of amino acid mole fractions with amino acid vectors in five reef tanks


Vitamins & Plastic Additives

Figure 7 shows the concentrations of eight vitamins. Nicotinamide was detectable in all tanks, while riboflavin, cyanocobalamin, and thiamine were not detected in any of the five tanks. Tank1 had the most diverse vitamin composition of the five, including folic acid, pyridoxine, nicotinamide, and pantothenic acid.

As for plastic additives (Figure 8), only four were detected in these tanks: bisisobutylphthalate, bismethylphthalate, dibutylphthalate, and diethylphthalate.

1786174622082.png

Figure 7. Concentrations of various vitamins in five reef tanks

1786174738082.png

Figure 8. Concentrations of four plastic additives detected in five reef tanks


Plant-Derived Compounds

Four plant-derived compounds were detected at quantifiable concentrations in these tanks: coumarin, betaine, salicylic acid, and caffeine.

1786174829924.png

Figure 9. Concentrations of four plant-derived compounds detected in five reef tanks


Correlation Analysis Between Selected Parameters

1786175672578.png

Figure 10. Correlation between SAC254 and total amino acid nitrogen (p = 0.5860)

1786176406592.png

Figure 11. Correlation between SAC254 and glycine (p = 0.0227)

1786176054492.png

Figure 12. Correlation between phosphate and total amino acid nitrogen (p = 0.9450)

1786176527064.png

Figure 13. Correlation between DMSP and total amino acid nitrogen (p = 0.226)

Medication

1786180977288.png

Figure 14. Fluconazole and ciprofloxacin concentrations


Non-Targeted Screening

tank1tank2tank3tank54F
FluconazoleFluconazoleFluconazoleFluconazoleFluconazole
Oxolinic acidOxolinic acidOxolinic acidOxolinic acidOxolinic acid
CrotamitonNicotinamideSucrose octaacetateSucrose octaacetateSucrose octaacetate
Cotinine N-oxide(S)-Nicotine(S)-NicotineBenzyl methacrylateBenzyl methacrylate
CaffeineCaffeineCaffeineCaffeineCaffeine
ParaxanthineMelamineMelamineParaxanthineTrometamol
Nicotinuric acidNicotinuric acidOridoninCrotamiton
CiprofloxacinTheobromineCiprofloxacinCiprofloxacin
CarbendazimPerfluoro-1-butanesulfonamide
4-Pyridoxic acidPerfluoro-1-butanesulfonic acid (PFBS)
(-)-CotinineZearalanol
Perfluorohexanoic acid


Here are a few things I found interesting:

1. Total amino acid nitrogen does not show much correlation with SAC254. However, if 4F is excluded, the relationship becomes a strong positive correlation, with a p-value of 0.02895.

2. Glycine is the only amino acid that shows a significant positive correlation with SAC254 without excluding any of the tanks.

3. Even though no inorganic nitrogen was detected in any of my tanks, total amino acid nitrogen still does not show any relationship with phosphate. I had originally expected at least a slightly negative correlation.

4. Aspartic acid and glycine concentrations in my tanks seem to be on the high end compared with reports from other reefers.

5. PCA of the amino acid mole fractions shows that the three stony coral-dominated tanks with skimmers and occasional water changes seem to have more similar amino acid compositions.

6. The amino acid composition of 4F is more enriched in several carbon-rich amino acids, such as Leu, Ile, Phe, Tyr, and Val.

7. Fluconazole, oxolinic acid, and ciprofloxacin had only been used to treat one of the tanks several months before the test, but several other systems still showed detectable amounts. This likely indicates that these compounds can be carried between systems fairly easily, possibly via rocks or corals.

8. Although the relationship was not statistically significant, DMSP did show a slightly negative correlation with total amino acid nitrogen.

9. Caffeine was detected in all tanks through non-targeted screening, which I'm not that surprised about since I do often drink coffee around these tanks. :)

If anyone wants to investigate these data further, I've also attached an XLSX file containing most of the raw data I received from Oceamo. I'd appreciate any feedback.
 

Attachments

Please send the results to @Dan_P. He has been collecting data from many people's reef tanks over time and surely could use the additional data.

Here's an overview of the already collected data (page 12, post #226):
https://www.reef2reef.com/threads/organo-ms-results-and-evaluations.1134232/post-14373569
Thanks @EnterName. @jeremie I downloaded your file and will add it to my amino acid database (58 samples) and see where it fits in. I will take a peek at the other analytes.
 
Please send the results to @Dan_P. He has been collecting data from many people's reef tanks over time and surely could use the additional data.

Here's an overview of the already collected data (page 12, post #226):
https://www.reef2reef.com/threads/organo-ms-results-and-evaluations.1134232/post-14373569
Thanks @EnterName. @jeremie I downloaded your file and will add it to my amino acid database (58 samples) and see where it fits in. I will take a peek at the other analytes.
Thanks! Looking forward to seeing more of your studies.

Here’s Figure 6, which seems to have gotten lost during editing, in case anyone’s wondering :)
1786195091760.png
 
Thanks! Looking forward to seeing more of your studies.

Here’s Figure 6, which seems to have gotten lost during editing, in case anyone’s wondering :)
1786195091760.png
I found that 4F is different in the amino acid world as well.
 
I recently received the Organo-MS and ICP-MS results from five reef tanks under my care. Although I don't think many firm conclusions can be drawn from only five samples, I still find it quite interesting to compare these data with some more detailed information about the tanks.

Here's some information about the tanks:

(1) All of the tanks were a little over 2 years old, although most of the rock and substrate came from older tanks.
(2) No filter media other than the rock and substrate in the display had been used during the three months before sampling.
(3) Three tanks had only a skimmer in the sump, while the other two did not even have a skimmer, just an empty sump with water flowing through it.
(4) No amino acids were dosed in any of these tanks.
(5) There was no deliberate coral feeding. The fish were fed pellets and frozen mysids.
(6) None of the tanks had detectable nitrate or nitrite.

1. tank1

Skimmer: Yes
Dosing: All-For-Reef, sodium monobasic phosphate, ammonium bicarbonate
Water change: 20–30% every 1–3 months
Substrate: 1 inch of crushed coral

The tank is a mixed reef dominated mostly by stony corals, with a lot of Stylophora pistillata. Alkalinity consumption was about 1.5 dKH per day. The tank had been treated with fluconazole and oxolinic acid 7 months before sampling, and ciprofloxacin 3 months before sampling, to deal with a hair algae bloom and a coral disease outbreak.

2. tank2

Skimmer: Yes
Dosing: DIY two-part, Tropic Marin A- & K+, sodium monobasic phosphate, ammonium bicarbonate
Water change: 20–30% every 1–3 months
Substrate: 1 inch of crushed coral

The tank is an SPS-dominated reef. Alkalinity consumption was about 4 dKH per day. The tank had been treated with milbemycin oxime 7 months before sampling to treat parasitic copepods on Acropora spp.

3. tank3

Skimmer: No
Dosing: Kalkwasser, magnesium chloride
Water change: No water changes for at least a year
Substrate: 1 inch of crushed coral

The tank is a soft coral-dominated reef. Alkalinity consumption was about 0.5 dKH per day.

4. tank5

Skimmer: Yes
Dosing: DIY two-part, Tropic Marin A- & K+, sodium monobasic phosphate, ammonium bicarbonate, sodium nitrate (occasional boost)
Water change: 20–30% every 1–3 months
Substrate: Bare bottom

The tank is an SPS-dominated reef. Alkalinity consumption was about 4 dKH per day.

5. 4F tank

Skimmer: No
Dosing: All-For-Reef, sodium monobasic phosphate, ammonium bicarbonate
Water change: No water changes for at least a year
Substrate: Bare bottom

The tank is a mixed reef, but most of the coral biomass is probably contributed by the large Sarcophyton. The tank has experienced occasional bacterial blooms for no apparent reason ever since it was set up. Alkalinity consumption was about 0.1 dKH per day.


Amino acids

Most of the tanks showed a fairly similar overall pattern, characterized by high glycine and aspartic acid concentrations (Figure 1). I then calculated the total amino acid nitrogen concentration in these tanks, with 4F and tank3 having the highest concentrations (Figure 2). The proportion of total amino acid nitrogen contributed by each amino acid was then calculated (Figure 3). Interestingly, in the 4F tank, which had the highest total amino acid nitrogen concentration, the proportions of nitrogen contributed by aspartic acid and glycine were lower than in the other tanks.

1786129336986.png

Figure 1. Concentrations of different amino acids in five reef tanks

1786129712163.png

Figure 2. Total amino acid nitrogen in five reef tanks

1786129562356.png

Figure 3. Proportion of total amino acid nitrogen contributed by different amino acids in five reef tanks


Principal component analysis (PCA) of amino acid data

PCA is a dimensionality-reduction method that transforms a high-dimensional dataset, such as the amino acid concentrations and proportions here, into a lower-dimensional representation, in this case, two dimensions, for easier visualization. It is somewhat similar to projecting the shadow of your hand (a 3D object) onto a flat surface under a light source. The 2D shadow still preserves some useful characteristics of the original object. PCA basically finds the directions that capture the greatest amount of variation in the original dataset and represents the samples along these new axes. Here, the data are reduced to two axes, PC1 and PC2, which capture most of the variation among the samples.

I performed PCA on the amino acid mole fraction and molar concentration data (Figures 4 and 5). In both plots, 4F is farther away from the other tanks along the PC1 axis, which explains most of the variation in both analyses (63.44% and 70.12%). Figure 6 also shows the vectors for each amino acid in the mole-fraction PCA. The separation of 4F from the other tanks appears to be mostly associated with higher proportions of arginine, leucine + isoleucine, phenylalanine, tyrosine, and valine, while tank3 seems to be characterized by higher proportions of glycine and serine.

Amino acid mole fraction.png

Figure 4. PCA plot of amino acid mole fractions in five reef tanks

newplot (1).png

Figure 5. PCA plot of amino acid concentrations in five reef tanks


Figure 6. PCA plot of amino acid mole fractions with amino acid vectors in five reef tanks


Vitamins & Plastic Additives

Figure 7 shows the concentrations of eight vitamins. Nicotinamide was detectable in all tanks, while riboflavin, cyanocobalamin, and thiamine were not detected in any of the five tanks. Tank1 had the most diverse vitamin composition of the five, including folic acid, pyridoxine, nicotinamide, and pantothenic acid.

As for plastic additives (Figure 8), only four were detected in these tanks: bisisobutylphthalate, bismethylphthalate, dibutylphthalate, and diethylphthalate.

1786174622082.png

Figure 7. Concentrations of various vitamins in five reef tanks

1786174738082.png

Figure 8. Concentrations of four plastic additives detected in five reef tanks


Plant-Derived Compounds

Four plant-derived compounds were detected at quantifiable concentrations in these tanks: coumarin, betaine, salicylic acid, and caffeine.

1786174829924.png

Figure 9. Concentrations of four plant-derived compounds detected in five reef tanks


Correlation Analysis Between Selected Parameters

1786175672578.png

Figure 10. Correlation between SAC254 and total amino acid nitrogen (p = 0.5860)

1786176406592.png

Figure 11. Correlation between SAC254 and glycine (p = 0.0227)

1786176054492.png

Figure 12. Correlation between phosphate and total amino acid nitrogen (p = 0.9450)

1786176527064.png

Figure 13. Correlation between DMSP and total amino acid nitrogen (p = 0.226)

Medication

1786180977288.png

Figure 14. Fluconazole and ciprofloxacin concentrations


Non-Targeted Screening

tank1tank2tank3tank54F
FluconazoleFluconazoleFluconazoleFluconazoleFluconazole
Oxolinic acidOxolinic acidOxolinic acidOxolinic acidOxolinic acid
CrotamitonNicotinamideSucrose octaacetateSucrose octaacetateSucrose octaacetate
Cotinine N-oxide(S)-Nicotine(S)-NicotineBenzyl methacrylateBenzyl methacrylate
CaffeineCaffeineCaffeineCaffeineCaffeine
ParaxanthineMelamineMelamineParaxanthineTrometamol
Nicotinuric acidNicotinuric acidOridoninCrotamiton
CiprofloxacinTheobromineCiprofloxacinCiprofloxacin
CarbendazimPerfluoro-1-butanesulfonamide
4-Pyridoxic acidPerfluoro-1-butanesulfonic acid (PFBS)
(-)-CotinineZearalanol
Perfluorohexanoic acid


Here are a few things I found interesting:

1. Total amino acid nitrogen does not show much correlation with SAC254. However, if 4F is excluded, the relationship becomes a strong positive correlation, with a p-value of 0.02895.

2. Glycine is the only amino acid that shows a significant positive correlation with SAC254 without excluding any of the tanks.

3. Even though no inorganic nitrogen was detected in any of my tanks, total amino acid nitrogen still does not show any relationship with phosphate. I had originally expected at least a slightly negative correlation.

4. Aspartic acid and glycine concentrations in my tanks seem to be on the high end compared with reports from other reefers.

5. PCA of the amino acid mole fractions shows that the three stony coral-dominated tanks with skimmers and occasional water changes seem to have more similar amino acid compositions.

6. The amino acid composition of 4F is more enriched in several carbon-rich amino acids, such as Leu, Ile, Phe, Tyr, and Val.

7. Fluconazole, oxolinic acid, and ciprofloxacin had only been used to treat one of the tanks several months before the test, but several other systems still showed detectable amounts. This likely indicates that these compounds can be carried between systems fairly easily, possibly via rocks or corals.

8. Although the relationship was not statistically significant, DMSP did show a slightly negative correlation with total amino acid nitrogen.

9. Caffeine was detected in all tanks through non-targeted screening, which I'm not that surprised about since I do often drink coffee around these tanks. :)

If anyone wants to investigate these data further, I've also attached an XLSX file containing most of the raw data I received from Oceamo. I'd appreciate any feedback.

Thanks for the detailed analysis. You found far more different types of organics than I did. Maybe because I use GAC and skimming.

Have you, or can you, calculate the percent of the fluconazole and cipro remaining and how many days later you tested to get a half life?
 
I found that 4F is different in the amino acid world as well.
Interesting. This tank has always behaved weirdly since the beginning, with bacteria blooms recurring so frequently that I don't even bother running a skimmer anymore because the pump gets clogged with biofilm very quickly.

Algae have also never really grown much in this tank. Instead, I mostly just get white biofilm on the glass.

I've always assumed that there might be some weird organic carbon source coming from the air. This is the only tank located in a different room, and it's also right next to a microbiology lab. The test did show quite a lot of different types of organics as well.


Thanks for the detailed analysis. You found far more different types of organics than I did. Maybe because I use GAC and skimming.
I deliberately stopped using carbon for three months to see what would accumulate.

I have used carbon on and off after the fluconazole treatment in tank1, although it seems that it wasn't enough to remove all of them.


Have you, or can you, calculate the percent of the fluconazole and cipro remaining and how many days later you tested to get a half life?
Sure. Although I did use carbon right after the fluconazole treatment, so the fluconazole calculation wouldn't represent the actual decomposition half life.

The fluconazole treatment was 8 mg/L, and four 30% water changes had been done before sampling. There was 4.8 µg/L left after 199 days.
8 × (70%)^4 = 1.9208 mg/L

199 / log₂(1920.8 / 4.8) ≈ 23.02 days

The cipro treatment was 3 mg/L, and one 30% water change was done right after the treatment. There was 20 µg/L left after about 90 days.
3 × 70% = 2.1 mg/L

90 / log₂(2100 / 20) ≈ 13.40 days


One weird observation worth noting is that the highest fluconazole concentration (9 µg/L) wasn't found in the tank I treated, but in tank3, which I never added any fluconazole to. I did move some corals and rocks between these tanks, and that seems to be the only route by which it could have entered tank3.


Great write up, I got the Organo MS back with suggestion but this helped me understand further!!
Thanks. Glad it helped :)
 
Sure. Although I did use carbon right after the fluconazole treatment, so the fluconazole calculation wouldn't represent the actual decomposition half life.

The fluconazole treatment was 8 mg/L, and four 30% water changes had been done before sampling. There was 4.8 µg/L left after 199 days.
8 × (70%)^4 = 1.9208 mg/L

199 / log₂(1920.8 / 4.8) ≈ 23.02 days

The cipro treatment was 3 mg/L, and one 30% water change was done right after the treatment. There was 20 µg/L left after about 90 days.
3 × 70% = 2.1 mg/L

90 / log₂(2100 / 20) ≈ 13.40 days


Perfect, thank you.

One of my reasons for asking is my supposition that folks using cipro for treating anemones have misunderstood the literature of its breakdown by “light”. Most users replace the cipro everyday because they thought the normal light on the anemone was breaking it down. More detailed studies show it is UV that degrades it in nature, not all light, and so it should be much more stable than claimed in an anemone hospital tank. Your data support this hypothesis.

For that reason, when I treated my magnifica, I did not do daily replacement.
 
Interesting. This tank has always behaved weirdly since the beginning, with bacteria blooms recurring so frequently that I don't even bother running a skimmer anymore because the pump gets clogged with biofilm very quickly.

Algae have also never really grown much in this tank. Instead, I mostly just get white biofilm on the glass.

I've always assumed that there might be some weird organic carbon source coming from the air. This is the only tank located in a different room, and it's also right next to a microbiology lab. The test did show quite a lot of different types of organics as well.
We should have fun comparing my amino acid profile stories with your observations about the aquaria. I have done a first pass analysis of the data and now I am trying to put a high level biological sense to it.
 
@EnterName, @Lasse

@jeremie here are my thought on your amino acid analysis.

Working Assumptions About Aquarium Amino Acids.
I am currently thinking about aquarium amino acids as a steady state pool that probably varies in concentration and amino acid composition throughout the day and probably differs from the pool in substrate pore water. I assume that the amino acid composition changes as the pool grows as many different biological processes add amino acids to the pool and contracts as many different biological processes consume amino acids. I also assume that the small size of the amino acid pool we are observing with our Oceamo test is heavily influenced by bacteria, both in the consumption and addition of amino acids. This would mean that the pool behavior might just reflect short term bacterial processing. In an upcoming experiment, I will observe what bacteria do with an amino acid pool throughout the day in a sample of aquarium water fed peptone.

A Word On Methods
In a recent amino acid study of vinegar dosed aquarium water, I observed amino acid pool size changes were caused mainly by changes to the concentrations of only eight amino acids: Ala, Asn, Glu, Gln, Pro, Ser, and Tau. I used this observation to divide the Oceamo amino acid results into two groups to analyze separately, the eight amino acids (Subset 1) and the remaining twelve (Subset 2). In another study, this reduction in amino acid number resulted in less ambiguous sample groupings in Principal Component Analyses. I also converted concentration data to nano-molar and log10 transformed it and the calculated mole fractions. This typically spreads out the data, and because environmental concentration data tends to be log normal, linearizes it. Below is the analysis of your Subset 1 amino acids, focusing on Ala, Glu, Gly and Ser. I don’t have a good justification yet but I am leaving out Tau concentration because it seems to represent another process, as does (maybe) the Asp concentration.

Analysis
The concentration and mole fraction profiles point to samples tank-1, 2, 3, 5 as being similar and hinting at 4F being different (two plots). This Gly and Ser dominated profile of Subset 1 has been detected in other aquarium samples. Would the corresponding Subset 2 profiles be similar?

Jer Conc Profile.png
Jer Mole Profile.png


By plotting amino acid concentration and mole fraction against the total concentration of amino acids in Subset 1, I am hoping to observe differences in a group of samples as the pool size increases. These difference will hopefully help elucidate the biological processes behind amino acid profiles. Here are the analysis narratives for your Subset 1 amino acids.

Jer Glu.png


Glu concentrations form a cluster of roughly constant concentration with sample 4F looking like an outlier. The corresponding Glu mole fraction trend shows the expected negative correlation with pool size increase, with sample 4F seemingly an outlier.

Jer Gly.png


Gly concentrations in contrast to Glu increase with the amino acid pool size with sample 4F in line with the other samples. The corresponding Gly mole fractions seem to have a positive correlation with pool size possibly indicating a larger increase than pool size. Sample 4F Gly mole fraction looks like it might stand out.

Jer Ala.png


Ala concentrations like those of Gly are positively correlated to pool size, with sample 4F way off the line. Ala mole fraction exhibits the expected near zero slope for the mole fraction with Sample 4F being outside the cluster of results.

Jer Ser.png


Ser like Gly concentration exhibits a positive correlation with pool size, including sample 4F. Interestingly, Ala mole fraction for sample 4F clusters with the rest of the samples on the expected near horizontal line.

The Gly/Ser/Ala content seems to be moving together and differently from Glu. Interesting, Ala in the 4F sample deviates from the cluster as it does for Glu. Because the total concentration range is relatively small, and the sample size is small, I won’t try to interpret the data any further. When I find more examples like yours, it might be time to come up with some possible explanations based on biology.
 
Thanks for the analysis. I would also add that all of my samples were collected about two hours after the lights were turned off.

Another possible factor that might have quite a large impact on the diel variation in amino acid composition would be excretion from photosynthetic organisms.

Cellular and extracellular production of carbohydrates and amino acids by the marine diatom Skeletonema costatum: Diel variations and effects of N depletion
This study found that the extracellular amino acid composition of a species of diatom varied both throughout the light cycle and depending on the growth phase it was in.

“Composition of the extracellular free amino acids changed significantly from exponential to stationary growth phase (Table 4). The proportions of acidic and small amino acids (Asp, Glu, Ala, Gly and Ser) decreased, while large hydrophobic amino acids (Ile, Leu, Phe and Val) increased in accordance with intracellular changes. But in contrast with the intracellular pool, extracellular Gln was below detection level during exponential growth, and then slightly increased during the stationary growth phase.”

"The composition of the cellular free amino acids also showed striking diel variation during exponential growth. Glutamine emerged as the principal amino acid during the photophase, effectively increasing the Gln:Glu ratio (Fig. 5). This ratio probably reflects the main route of NH4+ incorporation, the glutamine synthetase-glutamate synthase pathway. Thus, the high rate of N assimilation leads to an increasing Gln:Glu ratio in the photophase, and vice versa in the scotophase."

The mention of the GS-GOGAT pathway also got me thinking about whether the Gln/Glu ratio could be used as an indicator of nitrogen limitation. Most inorganic nitrogen assimilation in organisms in our tanks involves this pathway, in which glutamate is used to assimilate ammonium and form glutamine.

AVvXsEjkXOjbRU4ClzLFCdgIhLWI0cPYCg2bH4ONU3WvcvC7VbdJU68QnucIx3hS3Bvm907VSey8V23mU1RqdX6wt-91mpwPlqWiAR6FBcfFKNUYz2JiZiCJxDNmi0Me_BRfHn40xJiyj8-BUeQnvi685Po6VqEl1Vyd0JLAe2NN1sF1_hNs72a7k2pWBIx_x9_R
⁠
I plotted the relationship between the log10-transformed Gln/Glu ratio and PO4 concentration, and it did show a significant positive relationship (p = 0.0105).

I have also requested ammonium measurements for my samples from Oceamo, but it might take a while since they are currently on vacation.
 
I recently received the Organo-MS and ICP-MS results from five reef tanks under my care. Although I don't think many firm conclusions can be drawn from only five samples, I still find it quite interesting to compare these data with some more detailed information about the tanks.

Here's some information about the tanks:

(1) All of the tanks were a little over 2 years old, although most of the rock and substrate came from older tanks.
(2) No filter media other than the rock and substrate in the display had been used during the three months before sampling.
(3) Three tanks had only a skimmer in the sump, while the other two did not even have a skimmer, just an empty sump with water flowing through it.
(4) No amino acids were dosed in any of these tanks.
(5) There was no deliberate coral feeding. The fish were fed pellets and frozen mysids.
(6) None of the tanks had detectable nitrate or nitrite.

1. tank1

Skimmer: Yes
Dosing: All-For-Reef, sodium monobasic phosphate, ammonium bicarbonate
Water change: 20–30% every 1–3 months
Substrate: 1 inch of crushed coral

The tank is a mixed reef dominated mostly by stony corals, with a lot of Stylophora pistillata. Alkalinity consumption was about 1.5 dKH per day. The tank had been treated with fluconazole and oxolinic acid 7 months before sampling, and ciprofloxacin 3 months before sampling, to deal with a hair algae bloom and a coral disease outbreak.

2. tank2

Skimmer: Yes
Dosing: DIY two-part, Tropic Marin A- & K+, sodium monobasic phosphate, ammonium bicarbonate
Water change: 20–30% every 1–3 months
Substrate: 1 inch of crushed coral

The tank is an SPS-dominated reef. Alkalinity consumption was about 4 dKH per day. The tank had been treated with milbemycin oxime 7 months before sampling to treat parasitic copepods on Acropora spp.

3. tank3

Skimmer: No
Dosing: Kalkwasser, magnesium chloride
Water change: No water changes for at least a year
Substrate: 1 inch of crushed coral

The tank is a soft coral-dominated reef. Alkalinity consumption was about 0.5 dKH per day.

4. tank5

Skimmer: Yes
Dosing: DIY two-part, Tropic Marin A- & K+, sodium monobasic phosphate, ammonium bicarbonate, sodium nitrate (occasional boost)
Water change: 20–30% every 1–3 months
Substrate: Bare bottom

The tank is an SPS-dominated reef. Alkalinity consumption was about 4 dKH per day.

5. 4F tank

Skimmer: No
Dosing: All-For-Reef, sodium monobasic phosphate, ammonium bicarbonate
Water change: No water changes for at least a year
Substrate: Bare bottom

The tank is a mixed reef, but most of the coral biomass is probably contributed by the large Sarcophyton. The tank has experienced occasional bacterial blooms for no apparent reason ever since it was set up. Alkalinity consumption was about 0.1 dKH per day.


Amino acids

Most of the tanks showed a fairly similar overall pattern, characterized by high glycine and aspartic acid concentrations (Figure 1). I then calculated the total amino acid nitrogen concentration in these tanks, with 4F and tank3 having the highest concentrations (Figure 2). The proportion of total amino acid nitrogen contributed by each amino acid was then calculated (Figure 3). Interestingly, in the 4F tank, which had the highest total amino acid nitrogen concentration, the proportions of nitrogen contributed by aspartic acid and glycine were lower than in the other tanks.

1786129336986.png

Figure 1. Concentrations of different amino acids in five reef tanks

1786129712163.png

Figure 2. Total amino acid nitrogen in five reef tanks

1786129562356.png

Figure 3. Proportion of total amino acid nitrogen contributed by different amino acids in five reef tanks


Principal component analysis (PCA) of amino acid data

PCA is a dimensionality-reduction method that transforms a high-dimensional dataset, such as the amino acid concentrations and proportions here, into a lower-dimensional representation, in this case, two dimensions, for easier visualization. It is somewhat similar to projecting the shadow of your hand (a 3D object) onto a flat surface under a light source. The 2D shadow still preserves some useful characteristics of the original object. PCA basically finds the directions that capture the greatest amount of variation in the original dataset and represents the samples along these new axes. Here, the data are reduced to two axes, PC1 and PC2, which capture most of the variation among the samples.

I performed PCA on the amino acid mole fraction and molar concentration data (Figures 4 and 5). In both plots, 4F is farther away from the other tanks along the PC1 axis, which explains most of the variation in both analyses (63.44% and 70.12%). Figure 6 also shows the vectors for each amino acid in the mole-fraction PCA. The separation of 4F from the other tanks appears to be mostly associated with higher proportions of arginine, leucine + isoleucine, phenylalanine, tyrosine, and valine, while tank3 seems to be characterized by higher proportions of glycine and serine.

Amino acid mole fraction.png

Figure 4. PCA plot of amino acid mole fractions in five reef tanks

newplot (1).png

Figure 5. PCA plot of amino acid concentrations in five reef tanks


Figure 6. PCA plot of amino acid mole fractions with amino acid vectors in five reef tanks


Vitamins & Plastic Additives

Figure 7 shows the concentrations of eight vitamins. Nicotinamide was detectable in all tanks, while riboflavin, cyanocobalamin, and thiamine were not detected in any of the five tanks. Tank1 had the most diverse vitamin composition of the five, including folic acid, pyridoxine, nicotinamide, and pantothenic acid.

As for plastic additives (Figure 8), only four were detected in these tanks: bisisobutylphthalate, bismethylphthalate, dibutylphthalate, and diethylphthalate.

1786174622082.png

Figure 7. Concentrations of various vitamins in five reef tanks

1786174738082.png

Figure 8. Concentrations of four plastic additives detected in five reef tanks


Plant-Derived Compounds

Four plant-derived compounds were detected at quantifiable concentrations in these tanks: coumarin, betaine, salicylic acid, and caffeine.

1786174829924.png

Figure 9. Concentrations of four plant-derived compounds detected in five reef tanks


Correlation Analysis Between Selected Parameters

1786175672578.png

Figure 10. Correlation between SAC254 and total amino acid nitrogen (p = 0.5860)

1786176406592.png

Figure 11. Correlation between SAC254 and glycine (p = 0.0227)

1786176054492.png

Figure 12. Correlation between phosphate and total amino acid nitrogen (p = 0.9450)

1786176527064.png

Figure 13. Correlation between DMSP and total amino acid nitrogen (p = 0.226)

Medication

1786180977288.png

Figure 14. Fluconazole and ciprofloxacin concentrations


Non-Targeted Screening

tank1tank2tank3tank54F
FluconazoleFluconazoleFluconazoleFluconazoleFluconazole
Oxolinic acidOxolinic acidOxolinic acidOxolinic acidOxolinic acid
CrotamitonNicotinamideSucrose octaacetateSucrose octaacetateSucrose octaacetate
Cotinine N-oxide(S)-Nicotine(S)-NicotineBenzyl methacrylateBenzyl methacrylate
CaffeineCaffeineCaffeineCaffeineCaffeine
ParaxanthineMelamineMelamineParaxanthineTrometamol
Nicotinuric acidNicotinuric acidOridoninCrotamiton
CiprofloxacinTheobromineCiprofloxacinCiprofloxacin
CarbendazimPerfluoro-1-butanesulfonamide
4-Pyridoxic acidPerfluoro-1-butanesulfonic acid (PFBS)
(-)-CotinineZearalanol
Perfluorohexanoic acid


Here are a few things I found interesting:

1. Total amino acid nitrogen does not show much correlation with SAC254. However, if 4F is excluded, the relationship becomes a strong positive correlation, with a p-value of 0.02895.

2. Glycine is the only amino acid that shows a significant positive correlation with SAC254 without excluding any of the tanks.

3. Even though no inorganic nitrogen was detected in any of my tanks, total amino acid nitrogen still does not show any relationship with phosphate. I had originally expected at least a slightly negative correlation.

4. Aspartic acid and glycine concentrations in my tanks seem to be on the high end compared with reports from other reefers.

5. PCA of the amino acid mole fractions shows that the three stony coral-dominated tanks with skimmers and occasional water changes seem to have more similar amino acid compositions.

6. The amino acid composition of 4F is more enriched in several carbon-rich amino acids, such as Leu, Ile, Phe, Tyr, and Val.

7. Fluconazole, oxolinic acid, and ciprofloxacin had only been used to treat one of the tanks several months before the test, but several other systems still showed detectable amounts. This likely indicates that these compounds can be carried between systems fairly easily, possibly via rocks or corals.

8. Although the relationship was not statistically significant, DMSP did show a slightly negative correlation with total amino acid nitrogen.

9. Caffeine was detected in all tanks through non-targeted screening, which I'm not that surprised about since I do often drink coffee around these tanks. :)

If anyone wants to investigate these data further, I've also attached an XLSX file containing most of the raw data I received from Oceamo. I'd appreciate any feedback.

I did 2 reflections:
1) Very similar results despite diff dosing regime.
2) Very concerned about the antibiotics that not vanish. No new info though, cipro is not decomposed at all in nature and reason why it's forbidden in Europe.
Also an explanation maybe why systems sometimes crash after too much medications ?

Jonas
 
Perfect, thank you.

One of my reasons for asking is my supposition that folks using cipro for treating anemones have misunderstood the literature of its breakdown by “light”. Most users replace the cipro everyday because they thought the normal light on the anemone was breaking it down. More detailed studies show it is UV that degrades it in nature, not all light, and so it should be much more stable than claimed in an anemone hospital tank. Your data support this hypothesis.


For that reason, when I treated my magnifica, I did not do daily replacement.
Cipro is very stable and not decomposed in nature. Therefore we have great restrictions using this in Europe
 
I have also requested ammonium measurements for my samples from Oceamo, but it might take a while since they are currently on vacation.
I´m sorry to say but I do not think they are able to do such analyses in samples not analysed directly after sampling. NH3/NH4 changes to much during storage - in both ways. 4 years ago there was an urgent need of analysing NH3/NH4 in one tank at my previous workplace and I got that answer from @Christoph and I understand the reasons.

Sincerely Lasse
 
Cipro is very stable and not decomposed in nature. Therefore we have great restrictions using this in Europe

It has been shown to be decomposed by uv light.
 
Not everyone runs UV.
Nobody knows or tests if Cipro has been sufficiently decomposed before doing a water change.

So, what are you trying to say?

I was responding to the assertion that it does not break down in nature. There is uv in that setting. I agree that in-tank break down is much slower than folks reading that light broke it down assumed.
 
It has been shown to be decomposed by uv light.
I know but that's not reliable as you haven't that much UV in a tank (and this thread examplet this) , and also in nature that's not for sure as cipro can be in places where UV doesn't reach. This is the reason why it's listed as nature unfriendly and should be used only with prescriptions from doctors. Its strictly regulated in Europe.
 
I know but that's not reliable as you haven't that much UV in a tank (and this thread examplet this) , and also in nature that's not for sure as cipro can be in places where UV doesn't reach. This is the reason why it's listed as nature unfriendly and should be used only with prescriptions from doctors. Its strictly regulated in Europe.

OK, but your absolute statement that it is "not decomposed in nature" is too strong, IMO.

https://strathprints.strath.ac.uk/16363/

In contrast, a follow-up mesocosm-scale field study using low POC water showed that photodegradation could also dominate cipro fate. In conclusion, both adsorption and photodegradation strongly influence cipro fate in aquatic systems, although the dominant mechanism appears to depend upon the ambient POC level.
 

TOP 10 Trending Threads

WHAT IS THE LOUDEST PART OF YOUR REEF SYSTEM?

  • Return pump

    Votes: 4 4.5%
  • Powerheads or wavemakers

    Votes: 6 6.8%
  • Protein skimmer

    Votes: 19 21.6%
  • Overflow or drain

    Votes: 26 29.5%
  • Sump vibration or plumbing

    Votes: 1 1.1%
  • Cooling fans

    Votes: 9 10.2%
  • Dosing, ATO, or other equipment

    Votes: 5 5.7%
  • Nothing. My reef is surprisingly quiet

    Votes: 11 12.5%
  • Other (Tell us what makes the noise)

    Votes: 7 8.0%
Back
Top
Home
Post thread…
Market
What's new






