


Jebao/Jecod Pump Performance Curves

rpkneumann

Texas Reefer since 2020
View Badges
Joined
Aug 4, 2020
Messages
316
Reaction score
199
Location
Austin
Rating - 0%
0   0   0
We know that Jebao and Jecod are the same manufacturer with different distribution channels.
There are some slight generational changes in power consumption (lower) at the same performance rating between DCP (2017), MDP (2021 WiFI) and the latest DEP (2023? Bluetooth). BT is a great enhancements since most don't like the 2.f GHz Band Wifi solution. They also vary slightly in size, so some mechanical changes took part. Each generation gets slightly bigger.

IMO we can use the DCP Performance curve they publish for all generations since the changes are minimal.
It will help determining the right size for your needs.

Most cost effective source for these pumps is currently (May '24) Amazon.

You can find the chart here: Jebao DCP Performance Curve
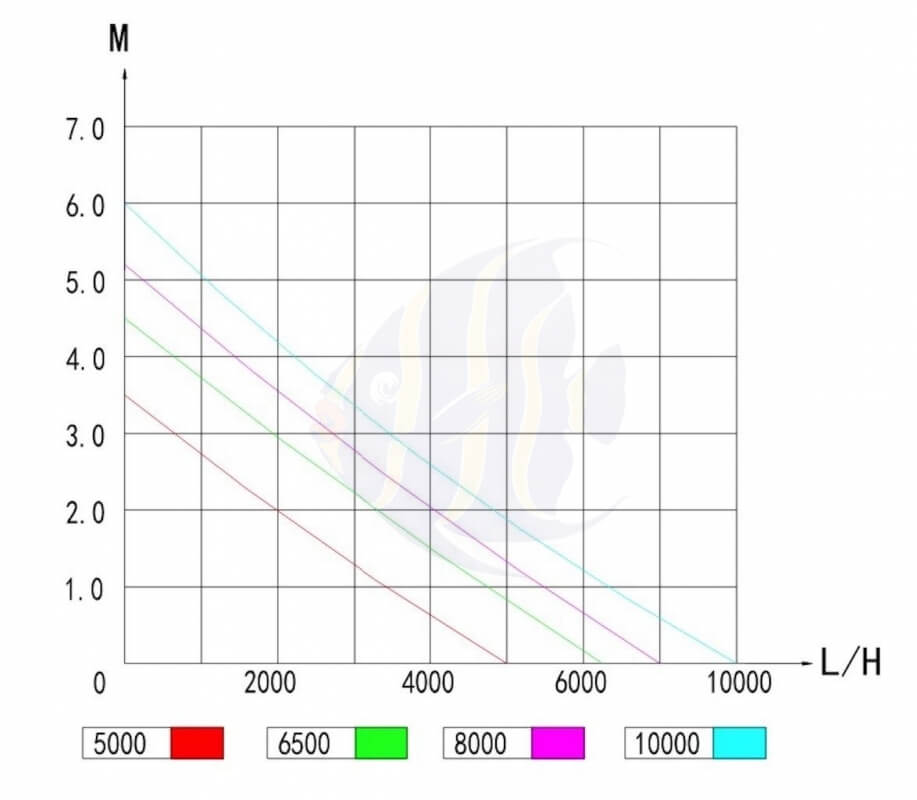
IMG_0554.jpeg
 
OP
OP
rpkneumann

rpkneumann

Texas Reefer since 2020
View Badges
Joined
Aug 4, 2020
Messages
316
Reaction score
199
Location
Austin
Rating - 0%
0   0   0
It’s for us techno nerds.
The curve helps to select a pump for your system.
It shows the actual throughput for the head value of your return line for different pumps.
Head in meters. Throughput in liters per hour
The different curves are different jebao pumps.
Just convert the metric values to US standard.
Every pump manufacturer usually shows these graphs for their pumps. Jebeo’s info was well hidden and not easy to find.
It helps you choose the right pump for your system or compare pump performance between manufacturers based on your system values.
The marketing info usually shows the pgh value at zero head. That’s not realistic.
Most systems have a head of 5 to 9 feet depending on how many elbows, valves and pipe length used and their diameter plus the actual hight from pump to outlet.
Does this answer your question?
 

Joe Rice

Active Member
View Badges
Joined
Aug 25, 2016
Messages
308
Reaction score
350
Location
Littleton, MA
Rating - 0%
0   0   0
It’s for us techno nerds.
The curve helps to select a pump for your system.
It shows the actual throughput for the head value of your return line for different pumps.
Head in meters. Throughput in liters per hour
The different curves are different jebao pumps.
Just convert the metric values to US standard.
Every pump manufacturer usually shows these graphs for their pumps. Jebeo’s info was well hidden and not easy to find.
It helps you choose the right pump for your system or compare pump performance between manufacturers based on your system values.
The marketing info usually shows the pgh value at zero head. That’s not realistic.
Most systems have a head of 5 to 9 feet depending on how many elbows, valves and pipe length used and their diameter plus the actual hight from pump to outlet.
Does this answer your question?
Threw me a bit how the x-axis is linear from 0 to 6000 then jumps to 10000 for the last two segments.
 

TOP 10 Trending Threads

DO YOU THINK TECHNOLOGICAL ADVANCEMENTS ARE MORE HELPFUL OR HURTFUL TO REEFING?

  • More helpful.

    Votes: 42 40.4%
  • More hurtful.

    Votes: 4 3.8%
  • I think it depends mostly on the technology.

    Votes: 41 39.4%
  • I think it dependsmostly on the reefer behind the technology.

    Votes: 33 31.7%
Back
Top
Home
Post thread…
Market
What's new




